

Comprehensive Annual Financial Report - City of Santa Monica
Comprehensive Annual Financial Report - City of Santa Monica
Comprehensive Annual Financial Report - City of Santa Monica

Create successful ePaper yourself
Turn your PDF publications into a flip-book with our unique Google optimized e-Paper software.
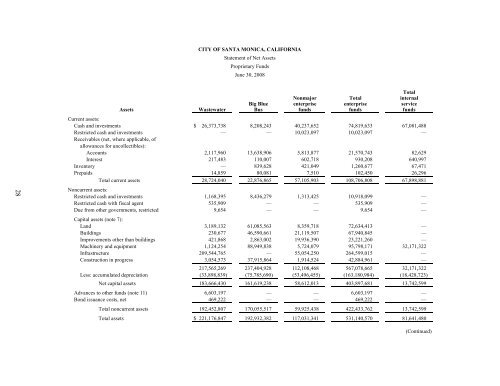
CITY OF SANTA MONICA, CALIFORNIA<br />
Statement <strong>of</strong> Net Assets<br />
Proprietary Funds<br />
June 30, 2008<br />
28<br />
Total<br />
Nonmajor Total internal<br />
Big Blue enterprise enterprise service<br />
Assets Wastewater Bus funds funds funds<br />
Current assets:<br />
Cash and investments $ 26,373,738 8,208,243 40,237,652 74,819,633 67,081,488<br />
Restricted cash and investments — — 10,023,097 10,023,097 —<br />
Receivables (net, where applicable, <strong>of</strong><br />
allowances for uncollectibles):<br />
Accounts 2,117,960 13,638,906 5,813,877 21,570,743 82,629<br />
Interest 217,483 110,007 602,718 930,208 640,997<br />
Inventory — 839,628 421,049 1,260,677 67,471<br />
Prepaids 14,859 80,081 7,510 102,450 26,296<br />
Total current assets 28,724,040 22,876,865 865 57,105,903 108,706,808 808 67,898,881<br />
881<br />
Noncurrent assets:<br />
Restricted cash and investments 1,168,395 8,436,279 1,313,425 10,918,099 —<br />
Restricted cash with fiscal agent 535,909 — — 535,909 —<br />
Due from other governments, restricted 9,654 — — 9,654 —<br />
Capital assets (note 7):<br />
Land 3,189,132 132 61,085,563 563 8,359,718 72,634,413 413<br />
—<br />
Buildings 230,677 46,590,661 21,119,507 67,940,845 —<br />
Improvements other than buildings 421,868 2,863,002 19,936,390 23,221,260 —<br />
Machinery and equipment 1,124,254 88,949,838 5,724,079 95,798,171 32,171,322<br />
Infrastructure 209,544,765 — 55,054,250 264,599,015 —<br />
Construction in progress 3,054,573 37,915,864 1,914,524 42,884,961 —<br />
217,565,269 , 237,404,928 , 112,108,468 , 567,078,665 , 32,171,322<br />
,<br />
Less: accumulated depreciation (33,898,839) (75,785,690) (53,496,455) (163,180,984) (18,428,723)<br />
Net capital assets 183,666,430 161,619,238 58,612,013 403,897,681 13,742,599<br />
Advances to other funds (note 11) 6,603,197 — — 6,603,197 —<br />
Bond issuance costs, net 469,222 — — 469,222 —<br />
Total noncurrent assets 192,452,807 170,055,517 59,925,438 422,433,762 13,742,599<br />
Total assets $ 221,176,847 192,932,382 117,031,341 531,140,570 81,641,480<br />
(Continued)


