CITY OF SANTA MONICA, CALIFORNIA Statement <strong>of</strong> Cash Flows Nonmajor Enterprise Funds For the fiscal year ended June 30, 2008 123 Total nonmajor Solid Civic Special Parking enterprise Water Waste Pier Auditorium Airport Stormwater Cemetery Aviation Authority funds Cash flows from operating activities: Cash received from customers $ 16,073,483 18,842,308 3,103,769 3,340,119 4,273,150 1,409,224 1,170,525 — 145,600 48,358,178 Cash payments for materials and services (9,639,997) (10,594,501) (3,415,784) (1,292,428) (3,079,042) (152,985) (948,722) — (281,127) (29,404,586) Cash payments to employees for services (4,938,672) (7,284,705) (1,481,051) (2,399,474) (1,155,845) — (620,462) — (849) (17,881,058) Other revenue received 316,699 457,333 44,708 — 210,922 247,311 — — — 1,276,973 Net cash provided by (used in) operating activities 1,811,513 1,420,435 (1,748,358) (351,783) 249,185 1,503,550 (398,659) — (136,376) 2,349,507 Cash flows from noncapital financing activities: Repayment <strong>of</strong> advances made to other funds — — — — (48,000) — — — — (48,000) Transfers in 249,404 39,506 840,134 16,667 53,556 2,595 332,762 — 3,670,150 5,204,774 Transfers out (1,208,845) (699,300) (12,500) — (16,200) (1,725,729) — — (2,779,790) (6,442,364) Net cash provided by (used in) noncapital financing activities (959,441) (659,794) 827,634 16,667 (10,644) (1,723,134) 332,762 — 890,360 (1,285,590) Cash flows from capital and related financing activities: Capital contributions received 440,000 — — — — — — — — 440,000 Acquisition and construction <strong>of</strong> capital assets (422,639) (95,939) (207,352) (451,392) (20,426) (863,828) (153,994) — (3,000,000) (5,215,570) Reduction in long-term obligations — — — — (442,218) (231,590) — — — (673,808) Advances from other funds — — — — — — 112,266 — — 112,266 Interest paid on long-term obligations (2,547) — — — (257,822) (91,733) — — — (352,102) Net cash (used in) capital and related financing 14,814 (95,939) (207,352) (451,392) (720,466) (1,187,151) (41,728) — (3,000,000) (5,689,214) Cash flows from investing activities: Interest on investments 622,357 330,581 303,037 126,583 117,952 41,321 10,296 8,782 439,650 2,000,559 Net cash provided by investing activities 622,357 330,581 303,037 126,583 117,952 41,321 10,296 8,782 439,650 2,000,559 Net increase (decrease) in cash and cash equivalents 1,489,243 995,283 (825,039) (659,925) (363,973) (1,365,414) (97,329) 8,782 (1,806,366) (2,624,738) Cash and cash equivalents at beginning <strong>of</strong> year 16,440,075 7,250,914 8,172,969 3,226,072 3,417,129 1,687,289 327,925 228,520 13,448,019 54,198,912 Cash and cash equivalents at end <strong>of</strong> year $ 17,929,318 8,246,197 7,347,930 2,566,147 3,053,156 321,875 230,596 237,302 11,641,653 51,574,174 Cash and investments $ 16,719,809 1,580,198 7,054,171 2,414,294 419,678 239,951 230,596 237,302 11,341,653 40,237,652 Restricted cash and investments 1,209,509 6,665,999 293,759 151,853 2,633,478 81,924 — — 300,000 11,336,522 Total cash and cash equivalents $ 17,929,318 8,246,197 7,347,930 2,566,147 3,053,156 321,875 230,596 237,302 11,641,653 51,574,174 (Continued)
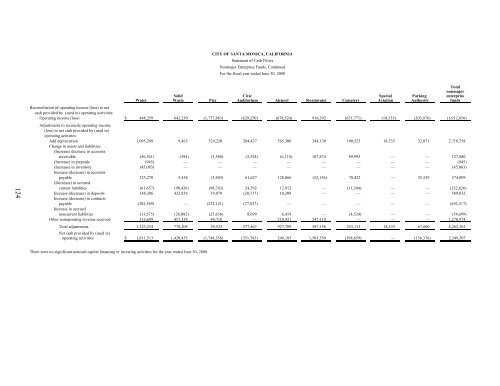
CITY OF SANTA MONICA, CALIFORNIA Statement <strong>of</strong> Cash Flows Nonmajor Enterprise Funds, Continued For the fiscal year ended June 30, 2008 124 Total nonmajor Solid Civic Special Parking enterprise Water Waste Pier Auditorium Airport Stormwater Cemetery Aviation Authority funds Reconciliation <strong>of</strong> operating income (loss) to net cash provided by (used in) operating activities: Operating income (loss) $ 488,259 642,230 (1,777,883) (629,250) (678,524) 916,392 (651,771) (18,333) (203,976) (1,912,856) Adjustments to reconcile operating income (loss) to net cash provided by (used in) operating activities: Add depreciation 1,095,289 9,463 329,220 284,427 565,300 284,130 100,525 18,333 32,071 2,718,758 Change in assets and liabilities: (Increase) decrease in accounts receivable (56,561) (394) (3,580) (3,334) (6,118) 107,874 89,993 — — 127,880 (Increase) in prepaids (945) — — — — — — — — (945) (Increase) in inventory (45,083) — — — — — — — — (45,083) Increase (decrease) in accounts payable 323,270 3,454 (3,403) 61,627 128,066 (52,156) 78,422 — 35,529 574,809 (Decrease) in accrued current liabilities (61,657) (98,426) (98,743) 24,592 12,912 — (11,304) — — (232,626) Increase (decrease) in deposits 148,386 432,856 19,078 (20,717) 10,209 — — — — 589,812 Increase (decrease) in contracts payable (382,569) — (232,121) (77,827) — — — — — (692,517) Increase in accrued noncurrent liabilities (13,575) (26,082) (25,636) 8,699 6,419 — (4,524) — — (54,699) Other nonoperating revenue received 316,699 457,334 44,710 — 210,921 247,310 — — — 1,276,974 Total adjustments 1,323,254 778,205 29,525 277,467 927,709 587,158 253,112 18,333 67,600 4,262,363 Net cash provided by (used in) operating activities $ 1,811,513 1,420,435 (1,748,358) (351,783) 249,185 1,503,550 (398,659) — (136,376) 2,349,507 There were no significant noncash capital financing or investing activities for the year ended June 30, 2008.
- Page 1 and 2:
City of Santa Monica Comprehensive
- Page 3 and 4:
City of Santa Monica, California Ye
- Page 5 and 6:
CITY OF SANTA MONICA, CALIFORNIA Co
- Page 7:
CITY OF SANTA MONICA, CALIFORNIA Co
- Page 10 and 11:
Master Plan; (2) an ongoing commitm
- Page 12 and 13:
needs of City infrastructure and fa
- Page 15 and 16:
OFFICIALS OF THE CITY OF SANTA MONI
- Page 17 and 18:
Certificate of Achievement for Exce
- Page 19 and 20:
The Honorable Mayor and City Counci
- Page 21 and 22:
CITY OF SANTA MONICA, CALIFORNIA Ma
- Page 23 and 24:
CITY OF SANTA MONICA, CALIFORNIA Ma
- Page 25 and 26:
CITY OF SANTA MONICA, CALIFORNIA Ma
- Page 27 and 28:
CITY OF SANTA MONICA, CALIFORNIA Ma
- Page 29 and 30:
CITY OF SANTA MONICA, CALIFORNIA Ma
- Page 31 and 32:
CITY OF SANTA MONICA, CALIFORNIA Ma
- Page 33 and 34:
City of Santa Monica, California Ye
- Page 35 and 36:
CITY OF SANTA MONICA, CALIFORNIA St
- Page 37 and 38:
CITY OF SANTA MONICA, CALIFORNIA Ba
- Page 39 and 40:
CITY OF SANTA MONICA, CALIFORNIA Re
- Page 41 and 42:
CITY OF SANTA MONICA, CALIFORNIA St
- Page 43 and 44:
CITY OF SANTA MONICA, CALIFORNIA St
- Page 45 and 46:
THIS PAGE INTENTIONALLY LEFT BLANK
- Page 47 and 48:
CITY OF SANTA MONICA, CALIFORNIA St
- Page 49 and 50:
CITY OF SANTA MONICA, CALIFORNIA St
- Page 51 and 52:
CITY OF SANTA MONICA, CALIFORNIA St
- Page 53 and 54:
CITY OF SANTA MONICA, CALIFORNIA St
- Page 55 and 56:
CITY OF SANTA MONICA, CALIFORNIA No
- Page 57 and 58:
CITY OF SANTA MONICA, CALIFORNIA No
- Page 59 and 60:
CITY OF SANTA MONICA, CALIFORNIA No
- Page 61 and 62:
CITY OF SANTA MONICA, CALIFORNIA No
- Page 63 and 64:
CITY OF SANTA MONICA, CALIFORNIA No
- Page 65 and 66:
CITY OF SANTA MONICA, CALIFORNIA No
- Page 67 and 68:
CITY OF SANTA MONICA, CALIFORNIA No
- Page 69 and 70:
CITY OF SANTA MONICA, CALIFORNIA No
- Page 71 and 72:
CITY OF SANTA MONICA, CALIFORNIA No
- Page 73 and 74:
CITY OF SANTA MONICA, CALIFORNIA No
- Page 75 and 76:
CITY OF SANTA MONICA, CALIFORNIA No
- Page 77 and 78:
CITY OF SANTA MONICA, CALIFORNIA No
- Page 79 and 80:
CITY OF SANTA MONICA, CALIFORNIA No
- Page 81 and 82:
CITY OF SANTA MONICA, CALIFORNIA No
- Page 83 and 84:
CITY OF SANTA MONICA, CALIFORNIA No
- Page 85 and 86:
CITY OF SANTA MONICA, CALIFORNIA No
- Page 87 and 88:
CITY OF SANTA MONICA, CALIFORNIA No
- Page 89 and 90:
CITY OF SANTA MONICA, CALIFORNIA No
- Page 91 and 92:
CITY OF SANTA MONICA, CALIFORNIA No
- Page 93 and 94: CITY OF SANTA MONICA, CALIFORNIA No
- Page 95 and 96: CITY OF SANTA MONICA, CALIFORNIA No
- Page 97 and 98: CITY OF SANTA MONICA, CALIFORNIA No
- Page 99 and 100: CITY OF SANTA MONICA, CALIFORNIA No
- Page 101 and 102: THIS PAGE INTENTIONALLY LEFT BLANK
- Page 103 and 104: CITY OF SANTA MONICA, CALIFORNIA Re
- Page 106 and 107: CITY OF SANTA MONICA, CALIFORNIA No
- Page 108 and 109: THIS PAGE INTENTIONALLY LEFT BLANK
- Page 110 and 111: CITY OF SANTA MONICA, CALIFORNIA Co
- Page 112 and 113: Total nonmajor Citizens special Mis
- Page 114 and 115: Total nonmajor Citizens special Mis
- Page 116 and 117: CITY OF SANTA MONICA, CALIFORNIA Sc
- Page 118 and 119: CITY OF SANTA MONICA, CALIFORNIA St
- Page 120 and 121: CITY OF SANTA MONICA, CALIFORNIA Sc
- Page 122 and 123: CITY OF SANTA MONICA, CALIFORNIA Sc
- Page 124 and 125: CITY OF SANTA MONICA, CALIFORNIA Sc
- Page 126 and 127: CITY OF SANTA MONICA, CALIFORNIA Sc
- Page 128 and 129: CITY OF SANTA MONICA, CALIFORNIA Co
- Page 130 and 131: CITY OF SANTA MONICA, CALIFORNIA Sc
- Page 132 and 133: CITY OF SANTA MONICA, CALIFORNIA Sc
- Page 134 and 135: THIS PAGE INTENTIONALLY LEFT BLANK
- Page 136 and 137: CITY OF SANTA MONICA, CALIFORNIA Co
- Page 138 and 139: CITY OF SANTA MONICA, CALIFORNIA Co
- Page 140 and 141: CITY OF SANTA MONICA, CALIFORNIA No
- Page 142 and 143: CITY OF SANTA MONICA, CALIFORNIA St
- Page 146 and 147: CITY OF SANTA MONICA, CALIFORNIA In
- Page 148 and 149: CITY OF SANTA MONICA, CALIFORNIA St
- Page 150 and 151: CITY OF SANTA MONICA, CALIFORNIA Fi
- Page 152 and 153: CITY OF SANTA MONICA, CALIFORNIA Co
- Page 154 and 155: City of Santa Monica, California Ye
- Page 156 and 157: CITY OF SANTA MONICA, CALIFORNIA Fo
- Page 158 and 159: CITY OF SANTA MONICA, CALIFORNIA Ch
- Page 160 and 161: CITY OF SANTA MONICA, CALIFORNIA Fu
- Page 162 and 163: CITY OF SANTA MONICA, CALIFORNIA Ch
- Page 164 and 165: CITY OF SANTA MONICA, CALIFORNIA As
- Page 166 and 167: CITY OF SANTA MONICA, CALIFORNIA Pr
- Page 168 and 169: CITY OF SANTA MONICA, CALIFORNIA Ta
- Page 170 and 171: CITY OF SANTA MONICA, CALIFORNIA Ra
- Page 172 and 173: CITY OF SANTA MONICA, CALIFORNIA Co
- Page 174 and 175: CITY OF SANTA MONICA, CALIFORNIA Re
- Page 176 and 177: CITY OF SANTA MONICA, CALIFORNIA Re
- Page 178 and 179: CITY OF SANTA MONICA, CALIFORNIA Pr
- Page 180 and 181: CITY OF SANTA MONICA, CALIFORNIA Op
- Page 182: THIS PAGE INTENTIONALLY LEFT BLANK