MAPP Handbook - The National Association of County and City ...
MAPP Handbook - The National Association of County and City ...
MAPP Handbook - The National Association of County and City ...

You also want an ePaper? Increase the reach of your titles
YUMPU automatically turns print PDFs into web optimized ePapers that Google loves.
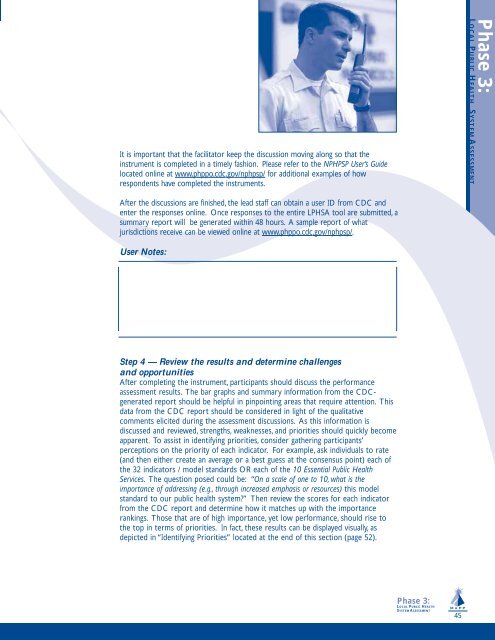
It is important that the facilitator keep the discussion moving along so that the<br />
instrument is completed in a timely fashion. Please refer to the NPHPSP User’s Guide<br />
located online at www.phppo.cdc.gov/nphpsp/ for additional examples <strong>of</strong> how<br />
respondents have completed the instruments.<br />
Phase 3:<br />
LOCAL PUBLIC HEALTH SYSTEM ASSESSMENT<br />
After the discussions are finished, the lead staff can obtain a user ID from CDC <strong>and</strong><br />
enter the responses online. Once responses to the entire LPHSA tool are submitted, a<br />
summary report will be generated within 48 hours. A sample report <strong>of</strong> what<br />
jurisdictions receive can be viewed online at www.phppo.cdc.gov/nphpsp/.<br />
User Notes:<br />
Step 4 — Review the results <strong>and</strong> determine challenges<br />
<strong>and</strong> opportunities<br />
After completing the instrument, participants should discuss the performance<br />
assessment results. <strong>The</strong> bar graphs <strong>and</strong> summary information from the CDCgenerated<br />
report should be helpful in pinpointing areas that require attention. This<br />
data from the CDC report should be considered in light <strong>of</strong> the qualitative<br />
comments elicited during the assessment discussions. As this information is<br />
discussed <strong>and</strong> reviewed, strengths, weaknesses, <strong>and</strong> priorities should quickly become<br />
apparent. To assist in identifying priorities, consider gathering participants’<br />
perceptions on the priority <strong>of</strong> each indicator. For example, ask individuals to rate<br />
(<strong>and</strong> then either create an average or a best guess at the consensus point) each <strong>of</strong><br />
the 32 indicators / model st<strong>and</strong>ards OR each <strong>of</strong> the 10 Essential Public Health<br />
Services. <strong>The</strong> question posed could be: “On a scale <strong>of</strong> one to 10, what is the<br />
importance <strong>of</strong> addressing (e.g., through increased emphasis or resources) this model<br />
st<strong>and</strong>ard to our public health system?” <strong>The</strong>n review the scores for each indicator<br />
from the CDC report <strong>and</strong> determine how it matches up with the importance<br />
rankings. Those that are <strong>of</strong> high importance, yet low performance, should rise to<br />
the top in terms <strong>of</strong> priorities. In fact, these results can be displayed visually, as<br />
depicted in “Identifying Priorities” located at the end <strong>of</strong> this section (page 52).<br />
Phase 3:<br />
LOCAL PUBLIC HEALTH<br />
SYSTEM ASSESSMENT<br />
45