MAPP Handbook - The National Association of County and City ...
MAPP Handbook - The National Association of County and City ...
MAPP Handbook - The National Association of County and City ...

You also want an ePaper? Increase the reach of your titles
YUMPU automatically turns print PDFs into web optimized ePapers that Google loves.
Step 4 — Organize <strong>and</strong> analyze the data; develop a compilation <strong>of</strong><br />
the findings; <strong>and</strong> disseminate the information<br />
At a minimum, data should be analyzed using demographic, socioeconomic, <strong>and</strong><br />
mortality measures. Additionally, analyzing data according to age, gender, racial, <strong>and</strong><br />
population subgroups <strong>of</strong>fers crucial insight into health disparities.<br />
Individuals with epidemiology expertise, computer skills, <strong>and</strong> statistics experience<br />
should help with data analysis. Small jurisdictions may want to contact the state health<br />
agency or academic institutions for assistance. Sparsely populated communities <strong>and</strong><br />
neighborhoods also face the unique challenge <strong>of</strong> interpreting “low numbers or<br />
incidence” into usable information. For suggestions on how to address this issue, see<br />
the tip sheet “Data Issues in Jurisdictions with Small Populations” at the end <strong>of</strong> this<br />
section (page 63).<br />
Phase 3:<br />
COMMUNITY HEALTH STATUS ASSESSMENT<br />
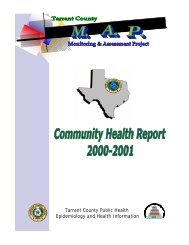
Once the data are analyzed, a compilation <strong>of</strong> the findings or a “community health<br />
pr<strong>of</strong>ile” should be developed. <strong>The</strong> community health pr<strong>of</strong>ile should include visual aids,<br />
such as charts <strong>and</strong> graphs that display the data in an underst<strong>and</strong>able <strong>and</strong> meaningful<br />
way. See the tip sheet “Presenting Data” located in the Tip Sheet Index on page 122 for<br />
more information.<br />
T<br />
ips from the field:<br />
• Look for existing resources.<br />
• Build on what the community has already done.<br />
• Use graphs <strong>and</strong> pictures to present the data.<br />
• Recognize <strong>and</strong> appreciate the difference between data that are<br />
statistically significant <strong>and</strong> those that are important to the<br />
community.<br />
Phase 3:<br />
COMMUNITY HEALTH<br />
STATUS ASSESSMENT<br />
59