Prospectus UBI Banca Covered Bond Programme
Prospectus UBI Banca Covered Bond Programme
Prospectus UBI Banca Covered Bond Programme

Create successful ePaper yourself
Turn your PDF publications into a flip-book with our unique Google optimized e-Paper software.
<strong>Prospectus</strong><br />
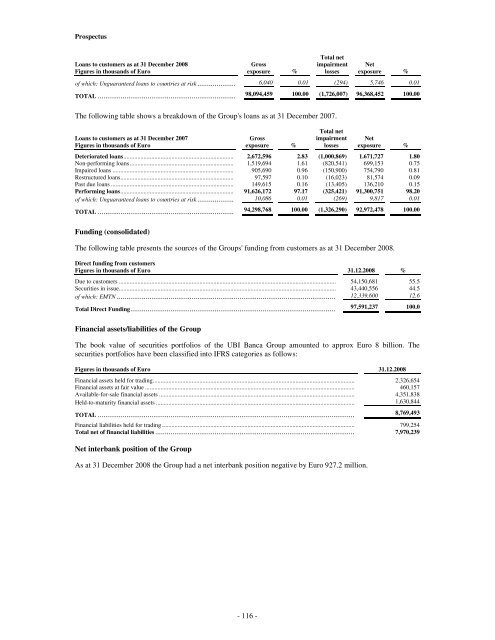
Loans to customers as at 31 December 2008<br />
Figures in thousands of Euro<br />
Gross<br />
exposure %<br />
Total net<br />
impairment<br />
losses<br />
Net<br />
exposure %<br />
of which: Unguaranteed loans to countries at risk.................... 6,040 0.01 (294) 5,746 0.01<br />
TOTAL ........................................................................ 98,094,459 100.00 (1,726,007) 96,368,452 100.00<br />
The following table shows a breakdown of the Group's loans as at 31 December 2007.<br />
Loans to customers as at 31 December 2007<br />
Figures in thousands of Euro<br />
Gross<br />
exposure %<br />
Total net<br />
impairment<br />
losses<br />
Net<br />
exposure %<br />
Deteriorated loans....................................................................... 2,672,596 2.83 (1,000,869) 1.671,727 1.80<br />
Non-performing loans................................................................... 1,519,694 1.61 (820,541) 699,153 0.75<br />
Impaired loans .............................................................................. 905,690 0.96 (150,900) 754,790 0.81<br />
Restructured loans......................................................................... 97,597 0.10 (16,023) 81,574 0.09<br />
Past due loans ............................................................................... 149,615 0.16 (13,405) 136,210 0.15<br />
Performing loans......................................................................... 91,626,172 97.17 (325,421) 91,300,751 98.20<br />
of which: Unguaranteed loans to countries at risk................... 10,086 0.01 (269) 9,817 0.01<br />
TOTAL ....................................................................... 94,298,768 100.00 (1,326,290) 92,972,478 100.00<br />
Funding (consolidated)<br />
The following table presents the sources of the Groups' funding from customers as at 31 December 2008.<br />
Direct funding from customers<br />
Figures in thousands of Euro 31.12.2008 %<br />
Due to customers ............................................................................................................................................ 54,150,681 55.5<br />
Securities in issue............................................................................................................................................ 43,440,556 44.5<br />
of which: EMTN .................................................................................................................. 12,339,600 12.6<br />
Total Direct Funding........................................................................................................... 97,591,237 100.0<br />
Financial assets/liabilities of the Group<br />
The book value of securities portfolios of the <strong>UBI</strong> <strong>Banca</strong> Group amounted to approx Euro 8 billion. The<br />
securities portfolios have been classified into IFRS categories as follows:<br />
Figures in thousands of Euro 31.12.2008<br />
Financial assets held for trading.................................................................................................................................. 2,326,654<br />
Financial assets at fair value ....................................................................................................................................... 460,157<br />
Available-for-sale financial assets .............................................................................................................................. 4,351,838<br />
Held-to-maturity financial assets ................................................................................................................................ 1,630,844<br />
TOTAL ...................................................................................................................................... 8,769,493<br />
Financial liabilities held for trading ............................................................................................................................ 799,254<br />
Total net of financial liabilities........................................................................................................ 7,970,239<br />
Net interbank position of the Group<br />
As at 31 December 2008 the Group had a net interbank position negative by Euro 927.2 million.<br />
- 116 -