OM t of c.iii - Vision Research Coordinating Center - Washington ...
OM t of c.iii - Vision Research Coordinating Center - Washington ...
OM t of c.iii - Vision Research Coordinating Center - Washington ...
Create successful ePaper yourself
Turn your PDF publications into a flip-book with our unique Google optimized e-Paper software.
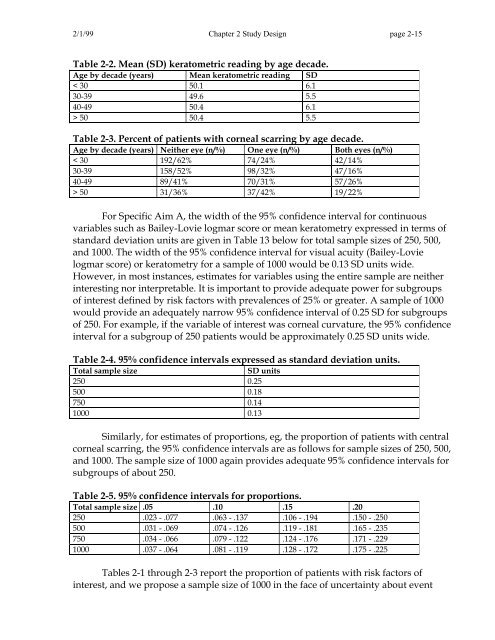
2/1/99 Chapter 2 Study Design page 2-15<br />
Table 2-2. Mean (SD) keratometric reading by age decade.<br />
Age by decade (years) Mean keratometric reading SD<br />
< 30 50.1 6.1<br />
30-39 49.6 5.5<br />
40-49 50.4 6.1<br />
> 50 50.4 5.5<br />
Table 2-3. Percent <strong>of</strong> patients with corneal scarring by age decade.<br />
Age by decade (years) Neither eye (n/%) One eye (n/%) Both eyes (n/%)<br />
< 30 192/62% 74/24% 42/14%<br />
30-39 158/52% 98/32% 47/16%<br />
40-49 89/41% 70/31% 57/26%<br />
> 50 31/36% 37/42% 19/22%<br />
For Specific Aim A, the width <strong>of</strong> the 95% confidence interval for continuous<br />
variables such as Bailey-Lovie logmar score or mean keratometry expressed in terms <strong>of</strong><br />
standard deviation units are given in Table 13 below for total sample sizes <strong>of</strong> 250, 500,<br />
and 1000. The width <strong>of</strong> the 95% confidence interval for visual acuity (Bailey-Lovie<br />
logmar score) or keratometry for a sample <strong>of</strong> 1000 would be 0.13 SD units wide.<br />
However, in most instances, estimates for variables using the entire sample are neither<br />
interesting nor interpretable. It is important to provide adequate power for subgroups<br />
<strong>of</strong> interest defined by risk factors with prevalences <strong>of</strong> 25% or greater. A sample <strong>of</strong> 1000<br />
would provide an adequately narrow 95% confidence interval <strong>of</strong> 0.25 SD for subgroups<br />
<strong>of</strong> 250. For example, if the variable <strong>of</strong> interest was corneal curvature, the 95% confidence<br />
interval for a subgroup <strong>of</strong> 250 patients would be approximately 0.25 SD units wide.<br />
Table 2-4. 95% confidence intervals expressed as standard deviation units.<br />
Total sample size<br />
SD units<br />
250 0.25<br />
500 0.18<br />
750 0.14<br />
1000 0.13<br />
Similarly, for estimates <strong>of</strong> proportions, eg, the proportion <strong>of</strong> patients with central<br />
corneal scarring, the 95% confidence intervals are as follows for sample sizes <strong>of</strong> 250, 500,<br />
and 1000. The sample size <strong>of</strong> 1000 again provides adequate 95% confidence intervals for<br />
subgroups <strong>of</strong> about 250.<br />
Table 2-5. 95% confidence intervals for proportions.<br />
Total sample size .05 .10 .15 .20<br />
250 .023 - .077 .063 - .137 .106 - .194 .150 - .250<br />
500 .031 - .069 .074 - .126 .119 - .181 .165 - .235<br />
750 .034 - .066 .079 - .122 .124 - .176 .171 - .229<br />
1000 .037 - .064 .081 - .119 .128 - .172 .175 - .225<br />
Tables 2-1 through 2-3 report the proportion <strong>of</strong> patients with risk factors <strong>of</strong><br />
interest, and we propose a sample size <strong>of</strong> 1000 in the face <strong>of</strong> uncertainty about event


