OM t of c.iii - Vision Research Coordinating Center - Washington ...
OM t of c.iii - Vision Research Coordinating Center - Washington ...
OM t of c.iii - Vision Research Coordinating Center - Washington ...

Create successful ePaper yourself
Turn your PDF publications into a flip-book with our unique Google optimized e-Paper software.
2/1/99 Chapter 2 Study Design page 2-16<br />
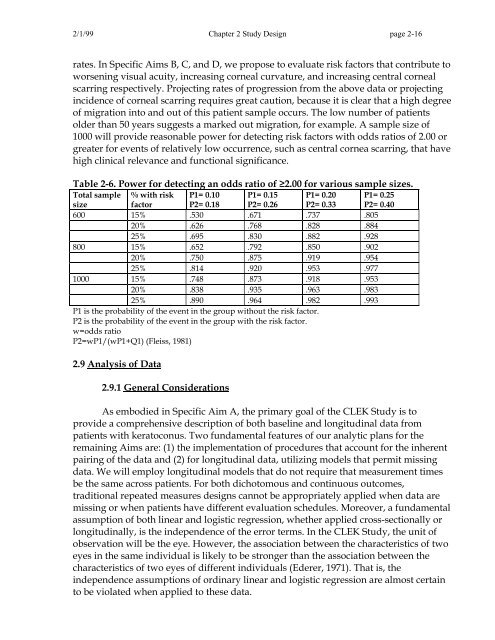
rates. In Specific Aims B, C, and D, we propose to evaluate risk factors that contribute to<br />
worsening visual acuity, increasing corneal curvature, and increasing central corneal<br />
scarring respectively. Projecting rates <strong>of</strong> progression from the above data or projecting<br />
incidence <strong>of</strong> corneal scarring requires great caution, because it is clear that a high degree<br />
<strong>of</strong> migration into and out <strong>of</strong> this patient sample occurs. The low number <strong>of</strong> patients<br />
older than 50 years suggests a marked out migration, for example. A sample size <strong>of</strong><br />
1000 will provide reasonable power for detecting risk factors with odds ratios <strong>of</strong> 2.00 or<br />
greater for events <strong>of</strong> relatively low occurrence, such as central cornea scarring, that have<br />
high clinical relevance and functional significance.<br />
Table 2-6. Power for detecting an odds ratio <strong>of</strong> ≥2.00 for various sample sizes.<br />
Total sample<br />
size<br />
% with risk<br />
factor<br />
P1= 0.10<br />
P2= 0.18<br />
P1= 0.15<br />
P2= 0.26<br />
P1= 0.20<br />
P2= 0.33<br />
P1= 0.25<br />
P2= 0.40<br />
600 15% .530 .671 .737 .805<br />
20% .626 .768 .828 .884<br />
25% .695 .830 .882 .928<br />
800 15% .652 .792 .850 .902<br />
20% .750 .875 .919 .954<br />
25% .814 .920 .953 .977<br />
1000 15% .748 .873 .918 .953<br />
20% .838 .935 .963 .983<br />
25% .890 .964 .982 .993<br />
P1 is the probability <strong>of</strong> the event in the group without the risk factor.<br />
P2 is the probability <strong>of</strong> the event in the group with the risk factor.<br />
w=odds ratio<br />
P2=wP1/(wP1+Q1) (Fleiss, 1981)<br />
2.9 Analysis <strong>of</strong> Data<br />
2.9.1 General Considerations<br />
As embodied in Specific Aim A, the primary goal <strong>of</strong> the CLEK Study is to<br />
provide a comprehensive description <strong>of</strong> both baseline and longitudinal data from<br />
patients with keratoconus. Two fundamental features <strong>of</strong> our analytic plans for the<br />
remaining Aims are: (1) the implementation <strong>of</strong> procedures that account for the inherent<br />
pairing <strong>of</strong> the data and (2) for longitudinal data, utilizing models that permit missing<br />
data. We will employ longitudinal models that do not require that measurement times<br />
be the same across patients. For both dichotomous and continuous outcomes,<br />
traditional repeated measures designs cannot be appropriately applied when data are<br />
missing or when patients have different evaluation schedules. Moreover, a fundamental<br />
assumption <strong>of</strong> both linear and logistic regression, whether applied cross-sectionally or<br />
longitudinally, is the independence <strong>of</strong> the error terms. In the CLEK Study, the unit <strong>of</strong><br />
observation will be the eye. However, the association between the characteristics <strong>of</strong> two<br />
eyes in the same individual is likely to be stronger than the association between the<br />
characteristics <strong>of</strong> two eyes <strong>of</strong> different individuals (Ederer, 1971). That is, the<br />
independence assumptions <strong>of</strong> ordinary linear and logistic regression are almost certain<br />
to be violated when applied to these data.