

World Bank Document
World Bank Document
World Bank Document

You also want an ePaper? Increase the reach of your titles
YUMPU automatically turns print PDFs into web optimized ePapers that Google loves.
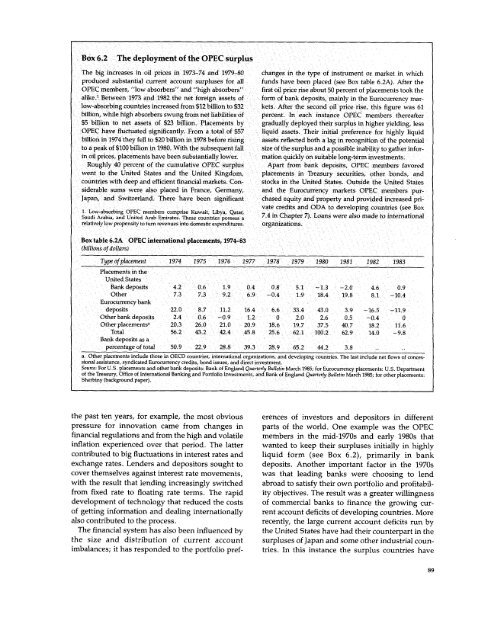
Box 6.2 The deployment of the OPEC surplus<br />
The big increases in oil prices in 1973-74 and 1979-80 changes in the type of instrument or market in which<br />
produced substantial current account surpluses for all funds have been placed (see Box table 6.2A). After the<br />
OPEC members, "low absorbers" and "high absorbers" first oil price rise about 50 percent of placements took the<br />
alike.' Between 1973 and 1982 the net foreign assets of form of bank deposits, mainly in the Eurocurrency marlow-absorbing<br />
countries increased from $12 billion to $32 kets. After the second oil price rise, this figure was 61<br />
billion, while high absorbers swung from net liabilities of percent. In each instance OPEC members thereafter<br />
$5 billion to net assets of $23 billion. Placements by gradually deployed their surplus in higher yielding, less<br />
OPEC have fluctuated significantly. From a total of $57 liquid assets. Their initial preference for highly liquid<br />
billion in 1974 they fell to $20 billion in 1978 before rising assets reflected both a lag in recognition of the potential<br />
to a peak of $100 billion in 1980. With the subsequent fall size of the surplus and a possible inability to gather inforin<br />
oil prices, placements have been substantially lower. mation quickly on suitable long-term investments.<br />
Roughly 40 percent of the cumulative OPEC surplus Apart from bank deposits, OPEC members favored<br />
went to the United States and the United Kingdom, placements in Treasury securities, other bonds, and<br />
countries with deep and efficient financial markets. Con- stocks in the United States. Outside the United States<br />
siderable sums were also placed in France, Germany, and the Eurocurrency markets OPEC members pur-<br />
Japan, and Switzerland. There have been significant chased equity and property and provided increased private<br />
credits and ODA to developing<br />
1. Low-absorbing OPEC members comprise Kuwait, Libya, Qatar, v 4 eite 7). OA dntesnattoa to<br />
countries (see Box<br />
Saudi Arabia, and United Arab Emirates. These countries possess a 7.4 m Chapter 7). Loans were also made to iternatona<br />
relatively low propensity to turn revenues into domestic expenditures. organizations.<br />
Box table 6.2A OPEC international placements, 1974-83<br />
(billions of dollars)<br />
Type of placement 1974 1975 1976 1977 1978 1979 1980 1981 1982 1983<br />
Placements<br />
United<br />
States<br />
in the<br />
<strong>Bank</strong> deposits 4.2 0.6 1.9 0.4 0.8 5.1 -1.3 -2.0 4.6 0.9<br />
Other 7.3 7.3 9.2 6.9 -0.4 1.9 18.4 19.8 8.1 -10.4<br />
Eurocurrency<br />
bank<br />
deposits 22.0 8.7 11.2 16.4 6.6 33.4 43.0 3.9 -16.5 -11.9<br />
Other bank deposits 2.4 0.6 -0.9 1.2 0 2.0 2.6 0.5 -0.4 0<br />
Other placements, 20.3 26.0 21.0 20.9 18.6 19.7 37.5 40.7 18.2 11.6<br />
Total 56.2 43.2 42.4 45.8 25.6 62.1 100.2 62.9 14.0 -9.8<br />
<strong>Bank</strong> deposits as a<br />
percentage of total 50.9 22.9 28.8 39.3 28.9 65.2 44.2 3.8<br />
a. Other placements include those in OECD countries, international organizations, and developing countries. The last include net flows of concessional<br />
assistance, syndicated Eurocurrency credits, bond issues, and direct investment.<br />
Source: For U.S. placements and other bank deposits: <strong>Bank</strong> of England Quarterly Bulletin March 1985; for Eurocurrency placements: U.S. Department<br />
of the Treasury, Office of International <strong>Bank</strong>ing and Portfolio Investments, and <strong>Bank</strong> of England Quarterly Bulletin March 1985; for other placements:<br />
Sherbiny (background paper).<br />
the past ten years, for example, the most obvious erences of investors and depositors in different<br />
pressure for innovation came from changes in parts of the world. One example was the OPEC<br />
financial regulations and from the high and volatile members in the mid-1970s and early 1980s that<br />
inflation experienced over that period. The latter wanted to keep their surpluses initially in highly<br />
contributed to big fluctuations in interest rates and liquid form (see Box 6.2), primarily in bank<br />
exchange rates. Lenders and depositors sought to deposits. Another important factor in the 1970s<br />
cover themselves against interest rate movements, was that leading banks were choosing to lend<br />
with the result that lending increasingly switched abroad to satisfy their own portfolio and profitabilfrom<br />
fixed rate to floating rate terms. The rapid ity objectives. The result was a greater willingness<br />
development of technology that reduced the costs of commercial banks to finance the growing curof<br />
getting information and dealing internationally rent account deficits of developing countries. More<br />
also contributed to the process.<br />
recently, the large current account deficits run by<br />
The financial system has also been influenced by the United States have had their counterpart in the<br />
the size and distribution of current account surpluses of Japan and some other industrial counimbalances;<br />
it has responded to the portfolio pref- tries. In this instance the surplus countries have<br />
89


