

World Bank Document
World Bank Document
World Bank Document

Create successful ePaper yourself
Turn your PDF publications into a flip-book with our unique Google optimized e-Paper software.
Box 3.1<br />
Primary commodity prices, business cycles, and the real exchange rate of the dollar<br />
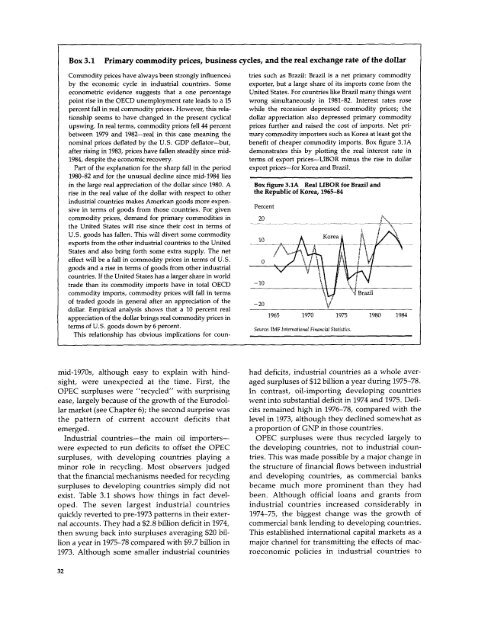
Commodity prices have always been strongly influenceu tries such as Brazil: Brazil is a net primary commodity<br />
by the economic cycle in industrial countries. Some exporter, but a large share of its imports come from the<br />
econometric evidence suggests that a one percentage United States. For countries like Brazil many things went<br />
point rise in the OECD unemployment rate leads to a 15 wrong simultaneously in 1981-82. Interest rates rose<br />
percent fall in real commodity prices. However, this rela- while the recession depressed commodity prices; the<br />
tionship seems to have changed in the present cyclical dollar appreciation also depressed primary commodity<br />
upswing. In real terms, commodity prices fell 44 percent prices further and raised the cost of imports. Net pribetween<br />
1979 and 1982-real in this case meaning the mary commodity importers such as Korea at least got the<br />
nominal prices deflated by the U.S. GDP deflator-but, benefit of cheaper commodity imports. Box figure 3.1A<br />
after rising in 1983, prices have fallen steadily since mid- demonstrates this by plotting the real interest rate in<br />
1984, despite the economic recovery. terms of export prices-LIBOR minus the rise in dollar<br />
Part of the explanation for the sharp fall in the period export prices-for Korea and Brazil.<br />
1980-82 and for the unusual decline since mid-1984 lies<br />
in the large real appreciation of the dollar since 1980. A Box figure 3.1A Real LIBOR for Brazil and<br />
rise in the real value of the dollar with respect to other the Republic of Korea, 1965-84<br />
industrial countries makes American goods more expensive<br />
in terms of goods from those countries. For given Percent<br />
commodity prices, demand for primary commodities in 20<br />
the United States will rise since their cost in terms of<br />
U.S. goods has fallen. This will divert some commodity<br />
Korea<br />
exports from the other industrial countries to the United _<br />
States and also bring forth some extra supply. The net<br />
effect will be a fall in commodity prices in terms of U.S. 0 J<br />
goods and a rise in terms of goods from other industrial<br />
countries. If the United States has a larger share in world \<br />
trade than its commodity imports have in total OECD -10<br />
commodity imports, commodity prices will fall in terms<br />
Brazil<br />
of traded goods in general after an appreciation of the -20 '<br />
dollar. Empirical analysis shows that a 10 percent real<br />
appreciation of the dollar brings real commodity prices in 1965 1970 1975 1980 1984<br />
terms of U.S. goods down by 6 percent.<br />
Source: IMF International Financial Statistics.<br />
This relationship has obvious implications for counmid-1970s,<br />
although easy to explain with hind- had deficits, industrial countries as a whole aversight,<br />
were unexpected at the time. First, the aged surpluses of $12 billion a year during 1975-78.<br />
OPEC surpluses were "recycled" with surprising In contrast, oil-importing developing countries<br />
ease, largely because of the growth of the Eurodol- went into substantial deficit in 1974 and 1975. Defilar<br />
market (see Chapter 6); the second surprise was cits remained high in 1976-78, compared with the<br />
the pattern of current account deficits that level in 1973, although they declined somewhat as<br />
emerged. a proportion of GNP in those countries.<br />
Industrial countries-the main oil importers- OPEC surpluses were thus recycled largely to<br />
were expected to run deficits to offset the OPEC the developing countries, not to industrial counsurpluses,<br />
with developing countries playing a tries. This was made possible by a major change in<br />
minor role in recycling. Most observers judged the structure of financial flows between industrial<br />
that the financial mechanisms needed for recycling and developing countries, as commercial banks<br />
surpluses to developing countries simply did not became much more prominent than they had<br />
exist. Table 3.1 shows how things in fact devel- been. Although official loans and grants from<br />
oped. The seven largest industrial countries industrial countries increased considerably in<br />
quickly reverted to pre-1973 patterns in their exter- 1974-75, the biggest change was the growth of<br />
nal accounts. They had a $2.8 billion deficit in 1974, commercial bank lending to developing countries.<br />
then swung back into surpluses averaging $20 bil- This established international capital markets as a<br />
lion a year in 1975-78 compared with $9.7 billion in major channel for transmitting the effects of mac-<br />
1973. Although some smaller industrial countries roeconomic policies in industrial countries to<br />
32


