Set of supplementary notes.
Set of supplementary notes.
Set of supplementary notes.

You also want an ePaper? Increase the reach of your titles
YUMPU automatically turns print PDFs into web optimized ePapers that Google loves.
5.1. BANDS AND BRILLOUIN ZONES 77<br />
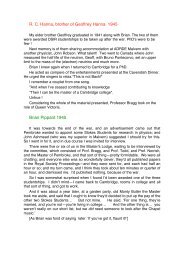
1D<br />
2D<br />
3D<br />
Figure 5.1: Density <strong>of</strong> states in one (top curve), two (middle curve) and three (lower curve)<br />
dimensions<br />
Figure 5.2: Surface <strong>of</strong> constant energy<br />
critical point) <strong>of</strong><br />
E(k) = E 0 ±<br />
h¯2<br />
k 2 h¯2<br />
x ± k 2 h¯2<br />
y ± kz 2 (5.13)<br />
2m x 2m y 2m z<br />
If all the signs in (5.13) are positive, this is a band minimum; if all negative, this is a band maximum;<br />
when the signs are mixed there is a saddle point. In the vicinity <strong>of</strong> each <strong>of</strong> these critical points, also<br />
called van Hove singularities, the density <strong>of</strong> states (or its derivative) is singular. In two dimensions, a<br />
saddle point gives rise to a logarithmically singular density <strong>of</strong> states, whereas in three dimensions there<br />
is a discontinuity in the derivative.