

1qGLG9p
1qGLG9p
1qGLG9p

You also want an ePaper? Increase the reach of your titles
YUMPU automatically turns print PDFs into web optimized ePapers that Google loves.
Global debt analysis: Deleveraging What deleveraging 13<br />
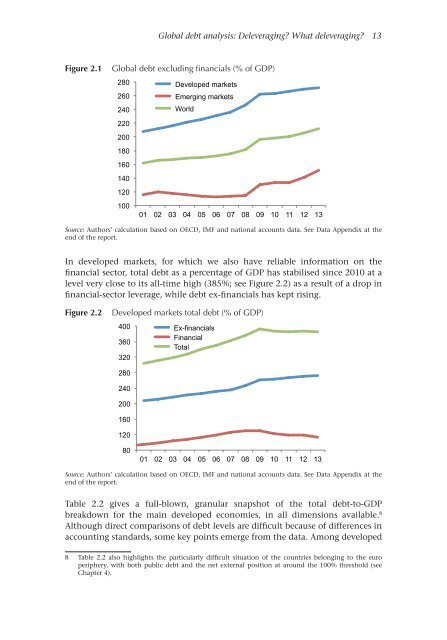
Figure 2.1<br />
Global debt excluding financials (% of GDP)<br />
280<br />
Developed markets<br />
260<br />
Emerging markets<br />
240<br />
World<br />
220<br />
200<br />
180<br />
160<br />
140<br />
120<br />
100<br />
01 02 03 04 05 06 07 08 09 10 11 12 13<br />
Source: Authors’ calculation based on OECD, IMF and national accounts data. See Data Appendix at the<br />
end of the report.<br />
In developed markets, for which we also have reliable information on the<br />
financial sector, total debt as a percentage of GDP has stabilised since 2010 at a<br />
level very close to its all-time high (385%; see Figure 2.2) as a result of a drop in<br />
financial-sector leverage, while debt ex-financials has kept rising.<br />
Figure 2.2<br />
Developed markets total debt (% of GDP)<br />
400<br />
360<br />
320<br />
Ex-financials<br />
Financial<br />
Total<br />
280<br />
240<br />
200<br />
160<br />
120<br />
80<br />
01 02 03 04 05 06 07 08 09 10 11 12 13<br />
Source: Authors’ calculation based on OECD, IMF and national accounts data. See Data Appendix at the<br />
end of the report.<br />
Table 2.2 gives a full-blown, granular snapshot of the total debt-to-GDP<br />
breakdown for the main developed economies, in all dimensions available. 8<br />
Although direct comparisons of debt levels are difficult because of differences in<br />
accounting standards, some key points emerge from the data. Among developed<br />
8 Table 2.2 also highlights the particularly difficult situation of the countries belonging to the euro<br />
periphery, with both public debt and the net external position at around the 100% threshold (see<br />
Chapter 4).