

1qGLG9p
1qGLG9p
1qGLG9p

Create successful ePaper yourself
Turn your PDF publications into a flip-book with our unique Google optimized e-Paper software.
68 Deleveraging, What Deleveraging<br />
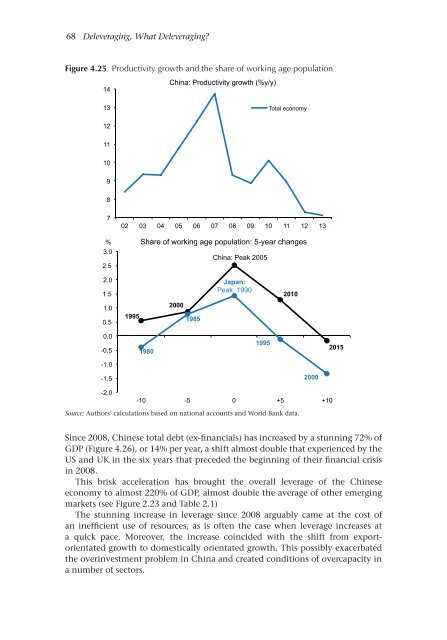
Figure 4.25 Productivity growth and the share of working age population<br />
14<br />
China: Productivity growth (%y/y)<br />
13<br />
Total economy<br />
12<br />
11<br />
10<br />
9<br />
8<br />
7<br />
02 03 04 05 06 07 08 09 10 11 12 13<br />
% Share of working age population: 5-year changes<br />
3.0<br />
China: Peak 2005<br />
2.5<br />
2.0<br />
1.5<br />
Japan:<br />
Peak: 1990<br />
2010<br />
1.0<br />
0.5<br />
1995<br />
2000<br />
1985<br />
0.0<br />
-0.5<br />
1980<br />
1995<br />
2015<br />
-1.0<br />
-1.5<br />
-2.0<br />
2000<br />
-10 -5 0 +5 +10<br />
Source: Authors’ calculations based on national accounts and World Bank data.<br />
Since 2008, Chinese total debt (ex-financials) has increased by a stunning 72% of<br />
GDP (Figure 4.26), or 14% per year, a shift almost double that experienced by the<br />
US and UK in the six years that preceded the beginning of their financial crisis<br />
in 2008.<br />
This brisk acceleration has brought the overall leverage of the Chinese<br />
economy to almost 220% of GDP, almost double the average of other emerging<br />
markets (see Figure 2.23 and Table 2.1)<br />
The stunning increase in leverage since 2008 arguably came at the cost of<br />
an inefficient use of resources, as is often the case when leverage increases at<br />
a quick pace. Moreover, the increase coincided with the shift from exportorientated<br />
growth to domestically orientated growth. This possibly exacerbated<br />
the overinvestment problem in China and created conditions of overcapacity in<br />
a number of sectors.