

1qGLG9p
1qGLG9p
1qGLG9p

You also want an ePaper? Increase the reach of your titles
YUMPU automatically turns print PDFs into web optimized ePapers that Google loves.
74 Deleveraging, What Deleveraging<br />
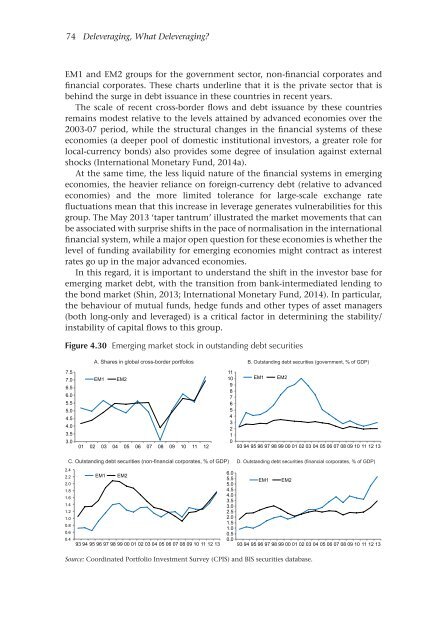
EM1 and EM2 groups for the government sector, non-financial corporates and<br />
financial corporates. These charts underline that it is the private sector that is<br />
behind the surge in debt issuance in these countries in recent years.<br />
The scale of recent cross-border flows and debt issuance by these countries<br />
remains modest relative to the levels attained by advanced economies over the<br />
2003-07 period, while the structural changes in the financial systems of these<br />
economies (a deeper pool of domestic institutional investors, a greater role for<br />
local-currency bonds) also provides some degree of insulation against external<br />
shocks (International Monetary Fund, 2014a).<br />
At the same time, the less liquid nature of the financial systems in emerging<br />
economies, the heavier reliance on foreign-currency debt (relative to advanced<br />
economies) and the more limited tolerance for large-scale exchange rate<br />
fluctuations mean that this increase in leverage generates vulnerabilities for this<br />
group. The May 2013 ‘taper tantrum’ illustrated the market movements that can<br />
be associated with surprise shifts in the pace of normalisation in the international<br />
financial system, while a major open question for these economies is whether the<br />
level of funding availability for emerging economies might contract as interest<br />
rates go up in the major advanced economies.<br />
In this regard, it is important to understand the shift in the investor base for<br />
emerging market debt, with the transition from bank-intermediated lending to<br />
the bond market (Shin, 2013; International Monetary Fund, 2014). In particular,<br />
the behaviour of mutual funds, hedge funds and other types of asset managers<br />
(both long-only and leveraged) is a critical factor in determining the stability/<br />
instability of capital flows to this group.<br />
Figure 4.30 Emerging market stock in outstanding debt securities<br />
A. Shares in global cross-border portfolios B. Outstanding debt securities (government, % of GDP)<br />
7.5<br />
7.0<br />
6.5<br />
6.0<br />
5.5<br />
5.0<br />
4.5<br />
4.0<br />
3.5<br />
3.0<br />
EM1<br />
EM2<br />
01 02 03 04 05 06 07 08 09 10 11 12<br />
11<br />
10<br />
9<br />
8<br />
7<br />
6<br />
5<br />
4<br />
3<br />
2<br />
1<br />
0<br />
EM1<br />
EM2<br />
93 94 95 96 97 98 99 00 01 02 03 04 05 06 07 08 09 10 11 12 13<br />
C. Outstanding debt securities (non-financial corporates, % of GDP) D. Outstanding debt securities (financial corporates, % of GDP)<br />
2.4<br />
2.2<br />
2.0<br />
1.8<br />
1.6<br />
1.4<br />
1.2<br />
1.0<br />
0.8<br />
0.6<br />
0.4<br />
EM1<br />
EM2<br />
93 94 95 96 97 98 99 00 01 02 03 04 05 06 07 08 09 10 11 12 13<br />
6.0<br />
5.5<br />
5.0<br />
4.5<br />
4.0<br />
3.5<br />
3.0<br />
2.5<br />
2.0<br />
1.5<br />
1.0<br />
0.5<br />
0.0<br />
EM1<br />
EM2<br />
93 94 95 96 97 98 99 00 01 02 03 04 05 06 07 08 09 10 11 12 13<br />
Source: Coordinated Portfolio Investment Survey (CPIS) and BIS securities database.