

1qGLG9p
1qGLG9p
1qGLG9p

You also want an ePaper? Increase the reach of your titles
YUMPU automatically turns print PDFs into web optimized ePapers that Google loves.
Case studies 39<br />
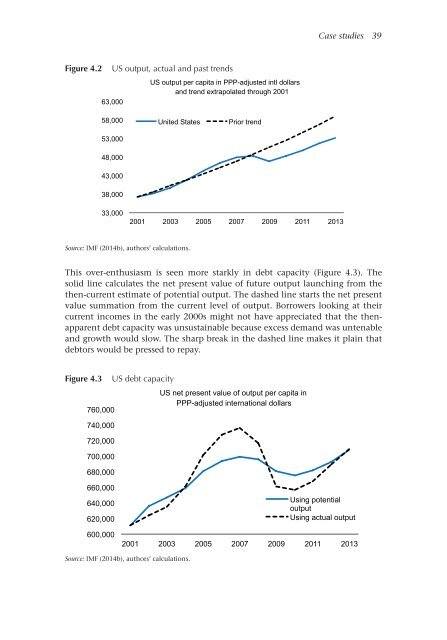
Figure 4.2<br />
US output, actual and past trends<br />
63,000<br />
US output per capita in PPP-adjusted intl dollars<br />
and trend extrapolated through 2001<br />
58,000<br />
53,000<br />
United States<br />
Prior trend<br />
48,000<br />
43,000<br />
38,000<br />
33,000<br />
2001 2003 2005 2007 2009 2011 2013<br />
Source: IMF (2014b), authors’ calculations.<br />
This over-enthusiasm is seen more starkly in debt capacity (Figure 4.3). The<br />
solid line calculates the net present value of future output launching from the<br />
then-current estimate of potential output. The dashed line starts the net present<br />
value summation from the current level of output. Borrowers looking at their<br />
current incomes in the early 2000s might not have appreciated that the thenapparent<br />
debt capacity was unsustainable because excess demand was untenable<br />
and growth would slow. The sharp break in the dashed line makes it plain that<br />
debtors would be pressed to repay.<br />
Figure 4.3<br />
760,000<br />
740,000<br />
720,000<br />
700,000<br />
680,000<br />
US debt capacity<br />
US net present value of output per capita in<br />
PPP-adjusted international dollars<br />
660,000<br />
640,000<br />
620,000<br />
600,000<br />
Using potential<br />
output<br />
Using actual output<br />
2001 2003 2005 2007 2009 2011 2013<br />
Source: IMF (2014b), authors’ calculations.