

1qGLG9p
1qGLG9p
1qGLG9p

Create successful ePaper yourself
Turn your PDF publications into a flip-book with our unique Google optimized e-Paper software.
Case studies 69<br />
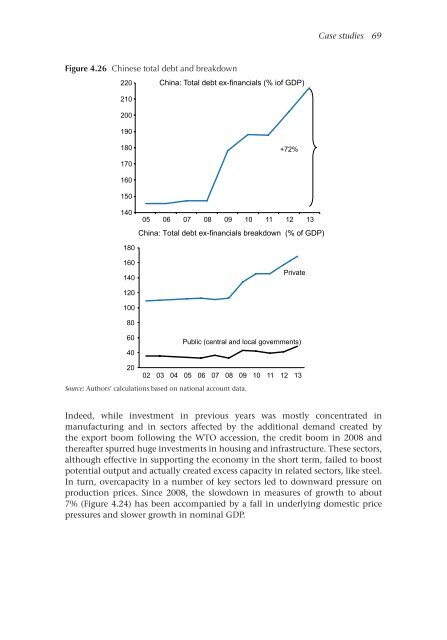
Figure 4.26 Chinese total debt and breakdown<br />
220 China: Total debt ex-financials (% iof GDP)<br />
210<br />
200<br />
190<br />
180<br />
+72%<br />
170<br />
160<br />
150<br />
140<br />
05 06 07 08 09 10 11 12 13<br />
China: Total debt ex-financials breakdown (% of GDP)<br />
180<br />
160<br />
140<br />
Private<br />
120<br />
100<br />
80<br />
60<br />
40<br />
Public (central and local governments)<br />
20<br />
02 03 04 05 06 07 08 09 10 11 12 13<br />
Source: Authors’ calculations based on national account data.<br />
Indeed, while investment in previous years was mostly concentrated in<br />
manufacturing and in sectors affected by the additional demand created by<br />
the export boom following the WTO accession, the credit boom in 2008 and<br />
thereafter spurred huge investments in housing and infrastructure. These sectors,<br />
although effective in supporting the economy in the short term, failed to boost<br />
potential output and actually created excess capacity in related sectors, like steel.<br />
In turn, overcapacity in a number of key sectors led to downward pressure on<br />
production prices. Since 2008, the slowdown in measures of growth to about<br />
7% (Figure 4.24) has been accompanied by a fall in underlying domestic price<br />
pressures and slower growth in nominal GDP.