Untitled
Untitled
Untitled

Create successful ePaper yourself
Turn your PDF publications into a flip-book with our unique Google optimized e-Paper software.
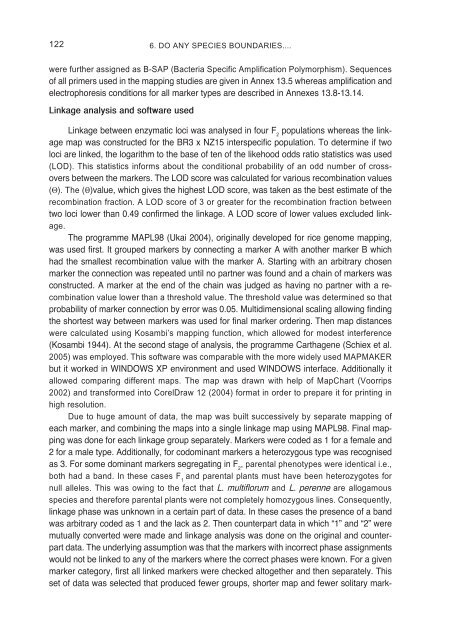
122<br />
6. DO ANY SPECIES BOUNDARIES....<br />
were further assigned as B-SAP (Bacteria Specific Amplification Polymorphism). Sequences<br />
of all primers used in the mapping studies are given in Annex 13.5 whereas amplification and<br />
electrophoresis conditions for all marker types are described in Annexes 13.8-13.14.<br />
Linkage analysis and software used<br />
Linkage between enzymatic loci was analysed in four F 2<br />
populations whereas the linkage<br />
map was constructed for the BR3 x NZ15 interspecific population. To determine if two<br />
loci are linked, the logarithm to the base of ten of the likehood odds ratio statistics was used<br />
(LOD). This statistics informs about the conditional probability of an odd number of crossovers<br />
between the markers. The LOD score was calculated for various recombination values<br />
(Θ). The (Θ)value, which gives the highest LOD score, was taken as the best estimate of the<br />
recombination fraction. A LOD score of 3 or greater for the recombination fraction between<br />
two loci lower than 0.49 confirmed the linkage. A LOD score of lower values excluded linkage.<br />
The programme MAPL98 (Ukai 2004), originally developed for rice genome mapping,<br />
was used first. It grouped markers by connecting a marker A with another marker B which<br />
had the smallest recombination value with the marker A. Starting with an arbitrary chosen<br />
marker the connection was repeated until no partner was found and a chain of markers was<br />
constructed. A marker at the end of the chain was judged as having no partner with a recombination<br />
value lower than a threshold value. The threshold value was determined so that<br />
probability of marker connection by error was 0.05. Multidimensional scaling allowing finding<br />
the shortest way between markers was used for final marker ordering. Then map distances<br />
were calculated using Kosambi’s mapping function, which allowed for modest interference<br />
(Kosambi 1944). At the second stage of analysis, the programme Carthagene (Schiex et al.<br />
2005) was employed. This software was comparable with the more widely used MAPMAKER<br />
but it worked in WINDOWS XP environment and used WINDOWS interface. Additionally it<br />
allowed comparing different maps. The map was drawn with help of MapChart (Voorrips<br />
2002) and transformed into CorelDraw 12 (2004) format in order to prepare it for printing in<br />
high resolution.<br />
Due to huge amount of data, the map was built successively by separate mapping of<br />
each marker, and combining the maps into a single linkage map using MAPL98. Final mapping<br />
was done for each linkage group separately. Markers were coded as 1 for a female and<br />
2 for a male type. Additionally, for codominant markers a heterozygous type was recognised<br />
as 3. For some dominant markers segregating in F 2<br />
, parental phenotypes were identical i.e.,<br />
both had a band. In these cases F 1<br />
and parental plants must have been heterozygotes for<br />
null alleles. This was owing to the fact that L. multiflorum and L. perenne are allogamous<br />
species and therefore parental plants were not completely homozygous lines. Consequently,<br />
linkage phase was unknown in a certain part of data. In these cases the presence of a band<br />
was arbitrary coded as 1 and the lack as 2. Then counterpart data in which “1” and “2” were<br />
mutually converted were made and linkage analysis was done on the original and counterpart<br />
data. The underlying assumption was that the markers with incorrect phase assignments<br />
would not be linked to any of the markers where the correct phases were known. For a given<br />
marker category, first all linked markers were checked altogether and then separately. This<br />
set of data was selected that produced fewer groups, shorter map and fewer solitary mark-


![wyklad 1 determinacja i dyferencjacja plci u ryb produkcja j [pdf]](https://img.yumpu.com/41397878/1/190x143/wyklad-1-determinacja-i-dyferencjacja-plci-u-ryb-produkcja-j-pdf.jpg?quality=85)