- Page 4 and 5: This research was done within the E
- Page 6 and 7: Acknowledgements I would like to th
- Page 8 and 9: 8 CONTENTS 4.4.4. Role of transposo
- Page 10 and 11: 10 CONTENTS 9.3.2. Similarity of ge
- Page 12 and 13: 12 1. INTRODUCTION
- Page 14 and 15: 14 1. INTRODUCTION occasionally use
- Page 16 and 17: 16 1. INTRODUCTION On the basis of
- Page 18 and 19: 18 1. INTRODUCTION The evidences fr
- Page 20 and 21: 20 1. INTRODUCTION overlap between
- Page 22 and 23: 22 1. INTRODUCTION et al. 2000; Cat
- Page 24 and 25: 24 1. INTRODUCTION According to the
- Page 26 and 27: 26 1. INTRODUCTION 1.6. APPLICATION
- Page 28 and 29: 28 1. INTRODUCTION of evolution wit
- Page 30 and 31: 30 1. INTRODUCTION are continuously
- Page 32 and 33: 2. GOALS The aim of this research w
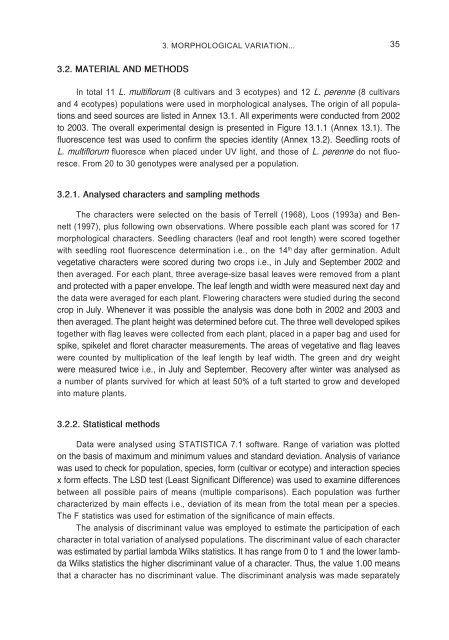
- Page 36 and 37: 36 3. MORPHOLOGICAL VARIATION... fo
- Page 38 and 39: 38 3. MORPHOLOGICAL VARIATION...
- Page 40 and 41: 40 3. MORPHOLOGICAL VARIATION... Wi
- Page 42 and 43: 42 3. MORPHOLOGICAL VARIATION... va
- Page 44 and 45: 44 3. MORPHOLOGICAL VARIATION... 3.
- Page 46 and 47: 46 3. MORPHOLOGICAL VARIATION...
- Page 48 and 49: 48 3. MORPHOLOGICAL VARIATION... in
- Page 50 and 51: 50 3. MORPHOLOGICAL VARIATION... pl
- Page 52 and 53: 52 3. MORPHOLOGICAL VARIATION... di
- Page 54 and 55: 4. GENETIC DIVERSITY OF L. MULTIFLO
- Page 56 and 57: 56 4. GENETIC DIVERSITY... deed con
- Page 58 and 59: 58 4. GENETIC DIVERSITY... 4.2.2. D
- Page 60 and 61: 60 4. GENETIC DIVERSITY...
- Page 62 and 63: 62 4. GENETIC DIVERSITY...
- Page 64 and 65: 64 4. GENETIC DIVERSITY... RAPD and
- Page 66 and 67: 66 4. GENETIC DIVERSITY... SSAP pol
- Page 68 and 69: 68 4. GENETIC DIVERSITY... It can b
- Page 70 and 71: 70 4. GENETIC DIVERSITY...
- Page 72 and 73: 72 4. GENETIC DIVERSITY... than wit
- Page 74 and 75: 74 4. GENETIC DIVERSITY...
- Page 76 and 77: 76 4. GENETIC DIVERSITY...
- Page 78 and 79: 78 4. GENETIC DIVERSITY...
- Page 80 and 81: 80 4. GENETIC DIVERSITY...
- Page 82 and 83: 82 4. GENETIC DIVERSITY... power of
- Page 84 and 85:
84 4. GENETIC DIVERSITY... Hamrick
- Page 86 and 87:
86 4. GENETIC DIVERSITY... deviatio
- Page 88 and 89:
88 4. GENETIC DIVERSITY... individu
- Page 90 and 91:
90 4. GENETIC DIVERSITY... (inversi
- Page 92 and 93:
92 4. GENETIC DIVERSITY... related
- Page 94 and 95:
94 4. GENETIC DIVERSITY... cies and
- Page 96 and 97:
96 4. GENETIC DIVERSITY... their sp
- Page 98 and 99:
98 4. GENETIC DIVERSITY... 4.5. CON
- Page 100 and 101:
100 5. ORIGIN OF SEEDLING... Applic
- Page 102 and 103:
102 5. ORIGIN OF SEEDLING... 5.2.2.
- Page 104 and 105:
104 5. ORIGIN OF SEEDLING... 5.3. R
- Page 106 and 107:
106 5. ORIGIN OF SEEDLING... very l
- Page 108 and 109:
108 5. ORIGIN OF SEEDLING... 5.3.4.
- Page 110 and 111:
110 5. ORIGIN OF SEEDLING... 5.4. D
- Page 112 and 113:
112 5. ORIGIN OF SEEDLING... A seco
- Page 114 and 115:
114 5. ORIGIN OF SEEDLING... Perhap
- Page 116 and 117:
6. DO ANY SPECIES BOUNDARIES EXIST
- Page 118 and 119:
118 6. DO ANY SPECIES BOUNDARIES...
- Page 120 and 121:
120 6. DO ANY SPECIES BOUNDARIES...
- Page 122 and 123:
122 6. DO ANY SPECIES BOUNDARIES...
- Page 124 and 125:
124 6. DO ANY SPECIES BOUNDARIES...
- Page 126 and 127:
126 6. DO ANY SPECIES BOUNDARIES...
- Page 128 and 129:
128 6. DO ANY SPECIES BOUNDARIES...
- Page 130 and 131:
130 6. DO ANY SPECIES BOUNDARIES...
- Page 132 and 133:
132 6. DO ANY SPECIES BOUNDARIES...
- Page 134 and 135:
134 6. DO ANY SPECIES BOUNDARIES...
- Page 136 and 137:
136 6. DO ANY SPECIES BOUNDARIES...
- Page 138 and 139:
138 6. DO ANY SPECIES BOUNDARIES...
- Page 140 and 141:
140 6. DO ANY SPECIES BOUNDARIES...
- Page 142 and 143:
142 6. DO ANY SPECIES BOUNDARIES...
- Page 144 and 145:
144 6. DO ANY SPECIES BOUNDARIES...
- Page 146 and 147:
146 6. DO ANY SPECIES BOUNDARIES...
- Page 148 and 149:
148 6. DO ANY SPECIES BOUNDARIES...
- Page 150 and 151:
150 6. DO ANY SPECIES BOUNDARIES...
- Page 152 and 153:
152 6. DO ANY SPECIES BOUNDARIES...
- Page 154 and 155:
154 6. DO ANY SPECIES BOUNDARIES...
- Page 156 and 157:
156 6. DO ANY SPECIES BOUNDARIES...
- Page 158 and 159:
7. ROLE OF QTL s IN THE EARLY EVOLU
- Page 160 and 161:
160 7. ROLE OF QTLs IN THE EARLY EV
- Page 162 and 163:
162 7. ROLE OF QTLs IN THE EARLY EV
- Page 164 and 165:
164 7. ROLE OF QTLs IN THE EARLY EV
- Page 166 and 167:
166 7. ROLE OF QTLs IN THE EARLY EV
- Page 168 and 169:
168 7. ROLE OF QTLs IN THE EARLY EV
- Page 170 and 171:
170 7. ROLE OF QTLs IN THE EARLY EV
- Page 172 and 173:
172 7. ROLE OF QTLs IN THE EARLY EV
- Page 174 and 175:
174 7. ROLE OF QTLs IN THE EARLY EV
- Page 176 and 177:
176 7. ROLE OF QTLs IN THE EARLY EV
- Page 178 and 179:
178 7. ROLE OF QTLs IN THE EARLY EV
- Page 180 and 181:
180 7. ROLE OF QTLs IN THE EARLY EV
- Page 182 and 183:
182 7. ROLE OF QTLs IN THE EARLY EV
- Page 184 and 185:
184 7. ROLE OF QTLs IN THE EARLY EV
- Page 186 and 187:
186 7. ROLE OF QTLs IN THE EARLY EV
- Page 188 and 189:
188 7. ROLE OF QTLs IN THE EARLY EV
- Page 190 and 191:
190 7. ROLE OF QTLs IN THE EARLY EV
- Page 192 and 193:
192 7. ROLE OF QTLs IN THE EARLY EV
- Page 194 and 195:
194 7. ROLE OF QTLs IN THE EARLY EV
- Page 196 and 197:
196 8. MOLECULAR PHYLOGENY OF THE G
- Page 198 and 199:
198 8. MOLECULAR PHYLOGENY OF THE G
- Page 200 and 201:
200 8. MOLECULAR PHYLOGENY OF THE G
- Page 202 and 203:
202 8. MOLECULAR PHYLOGENY OF THE G
- Page 204 and 205:
204 8. MOLECULAR PHYLOGENY OF THE G
- Page 206 and 207:
206 8. MOLECULAR PHYLOGENY OF THE G
- Page 208 and 209:
208 8. MOLECULAR PHYLOGENY OF THE G
- Page 210 and 211:
210 8. MOLECULAR PHYLOGENY OF THE G
- Page 212 and 213:
212 8. MOLECULAR PHYLOGENY OF THE G
- Page 214 and 215:
214 8. MOLECULAR PHYLOGENY OF THE G
- Page 216 and 217:
216 8. MOLECULAR PHYLOGENY OF THE G
- Page 218 and 219:
218 8. MOLECULAR PHYLOGENY OF THE G
- Page 220 and 221:
220 8. MOLECULAR PHYLOGENY OF THE G
- Page 222 and 223:
9. PHYLOGENETIC RELATIONSHIPS BETWE
- Page 224 and 225:
224 9. PHYLOGENETIC RELATIONSHIPS..
- Page 226 and 227:
226 9. PHYLOGENETIC RELATIONSHIPS..
- Page 228 and 229:
228 9. PHYLOGENETIC RELATIONSHIPS..
- Page 230 and 231:
230 9. PHYLOGENETIC RELATIONSHIPS..
- Page 232 and 233:
232 9. PHYLOGENETIC RELATIONSHIPS..
- Page 234 and 235:
234 9. PHYLOGENETIC RELATIONSHIPS..
- Page 236 and 237:
10. MARKER EFFICIENCY 10.1. INTRODU
- Page 238 and 239:
238 10. MARKER EFFICIENCY 10.3. DNA
- Page 240 and 241:
240 10. MARKER EFFICIENCY method. H
- Page 242 and 243:
242 10. MARKER EFFICIENCY alleles p
- Page 244 and 245:
244 10. MARKER EFFICIENCY proportio
- Page 246 and 247:
246 10. MARKER EFFICIENCY 10.7. CON
- Page 248 and 249:
248 11. CONCLUSIONS ABOUT EVOLUTION
- Page 250 and 251:
250 12, LITERATURE CITED Bączkiewi
- Page 252 and 253:
252 12, LITERATURE CITED Clayton WD
- Page 254 and 255:
254 12, LITERATURE CITED Giddings G
- Page 256 and 257:
256 12, LITERATURE CITED Jing R, Kn
- Page 258 and 259:
258 12, LITERATURE CITED MacDonald
- Page 260 and 261:
260 12, LITERATURE CITED Payne RC,
- Page 262 and 263:
262 12, LITERATURE CITED Schiex T,
- Page 264 and 265:
264 12, LITERATURE CITED United Sta
- Page 266 and 267:
266 12, LITERATURE CITED Zielinski
- Page 268 and 269:
268 13. SUPPLEMENTARY MATERIALS pla
- Page 270 and 271:
270 13. SUPPLEMENTARY MATERIALS
- Page 272 and 273:
272 13. SUPPLEMENTARY MATERIALS
- Page 274 and 275:
274 13. SUPPLEMENTARY MATERIALS ANN
- Page 276 and 277:
276 13. SUPPLEMENTARY MATERIALS ANN
- Page 278 and 279:
278 13. SUPPLEMENTARY MATERIALS
- Page 280 and 281:
280 13. SUPPLEMENTARY MATERIALS Ann
- Page 282 and 283:
282 13. SUPPLEMENTARY MATERIALS Ann
- Page 284 and 285:
284 13. SUPPLEMENTARY MATERIALS Ann
- Page 286 and 287:
286 13. SUPPLEMENTARY MATERIALS ANN
- Page 288 and 289:
288 13. SUPPLEMENTARY MATERIALS ANN
- Page 290 and 291:
290 13. SUPPLEMENTARY MATERIALS •
- Page 292 and 293:
292 13. SUPPLEMENTARY MATERIALS The
- Page 294 and 295:
294 13. SUPPLEMENTARY MATERIALS
- Page 296 and 297:
296 13. SUPPLEMENTARY MATERIALS fie
- Page 298 and 299:
298 13. SUPPLEMENTARY MATERIALS ANN
- Page 300 and 301:
300 13. SUPPLEMENTARY MATERIALS ANN
- Page 302 and 303:
302 13. SUPPLEMENTARY MATERIALS Ann
- Page 304 and 305:
The average gene diversity between
- Page 306 and 307:
306 13. SUPPLEMENTARY MATERIALS Unb
- Page 308 and 309:
308 14. ABBREVIATIONS Lolcopia1 - L
- Page 310 and 311:
310 14. ABBREVIATIONS Drosophila wi
- Page 312 and 313:
312 14. ABBREVIATIONS Saccharomyces
- Page 314 and 315:
314 15. SUMMARY At different stages
- Page 316 and 317:
316 15. SUMMARY L. multiflorum mito
- Page 318 and 319:
REVIEWERS’ COMMENTS With a great


![wyklad 1 determinacja i dyferencjacja plci u ryb produkcja j [pdf]](https://img.yumpu.com/41397878/1/190x143/wyklad-1-determinacja-i-dyferencjacja-plci-u-ryb-produkcja-j-pdf.jpg?quality=85)