
Create successful ePaper yourself
Turn your PDF publications into a flip-book with our unique Google optimized e-Paper software.
Soil <strong>gas</strong> analyses were as follows:<br />
• Gas composition: hydrocarbons (C1-C5), Ar, N2, O 2 , CO 2 , H 2 and He<br />
• Isotope analysis: 13 C carbon isotope ratio(δ 13 C) of CO 2 and CH 4<br />
Results of analyses indicate that:<br />
• In the samples of 06/04/18 and 06/ 5/24, CO2 contents of G3 and G-3-3 exceed 1%, but<br />
others are less.<br />
• In the samples of 06/07/14 and 06/9/12, G-3-3 is still has a high CO 2 content, but G-3<br />
has decreased to less 1%.<br />
• CO 2 content of G-2 increased to over 1%.<br />
• There is no relationship between CO 2 contents and 13 C values in the samples with CO 2<br />
contents exceeding 1%.<br />
• Hydrocarbon contents are 10 ppm in all samples.<br />
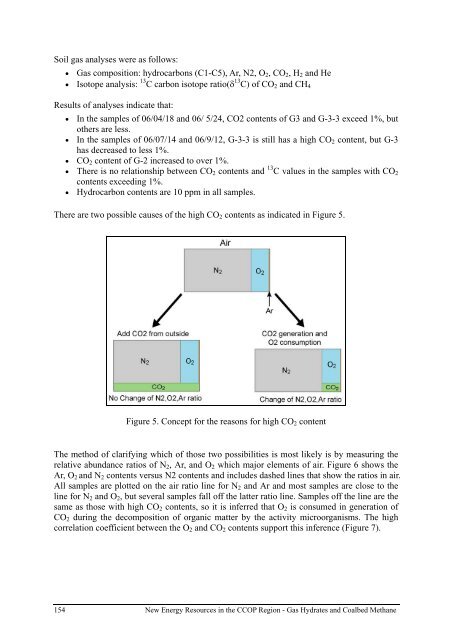
There are two possible causes of the high CO 2 contents as indicated in Figure 5.<br />
Figure 5. Concept for the reasons for high CO 2 content<br />
The method of clarifying which of those two possibilities is most likely is by measuring the<br />
relative abundance ratios of N 2 , Ar, and O 2 which major elements of air. Figure 6 shows the<br />
Ar, O 2 and N 2 contents versus N2 contents and includes dashed lines that show the ratios in air.<br />
All samples are plotted on the air ratio line for N 2 and Ar and most samples are close to the<br />
line for N 2 and O 2 , but several samples fall off the latter ratio line. Samples off the line are the<br />
same as those with high CO 2 contents, so it is inferred that O 2 is consumed in generation of<br />
CO 2 during the decomposition of organic matter by the activity microorganisms. The high<br />
correlation coefficient between the O 2 and CO 2 contents support this inference (Figure 7).<br />
154 New Energy Resources in the <strong>CCOP</strong> Region - Gas Hydrates and Coalbed Methane