
You also want an ePaper? Increase the reach of your titles
YUMPU automatically turns print PDFs into web optimized ePapers that Google loves.
Temper at ur e <br />
2<br />
1<br />
0<br />
-1<br />
-2<br />
-3<br />
-4<br />
0 10 20 30 40 50<br />
Ti me<br />
min<br />
Por t 1<br />
Por t 2<br />
Por t 3<br />
Por t 4<br />
Envi r onment<br />
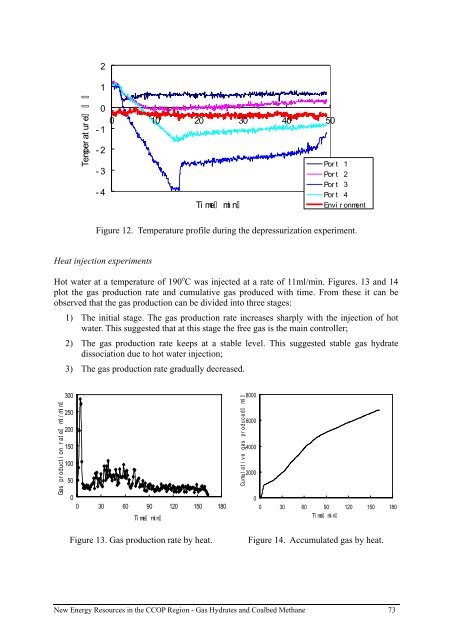
Figure 12. Temperature profile during the depressurization experiment.<br />
Heat injection experiments<br />
Hot water at a temperature of 190 o C was injected at a rate of 11ml/min. Figures. 13 and 14<br />
plot the <strong>gas</strong> production rate and cumulative <strong>gas</strong> produced with time. From these it can be<br />
observed that the <strong>gas</strong> production can be divided into three stages:<br />
1) The initial stage. The <strong>gas</strong> production rate increases sharply with the injection of hot<br />
water. This suggested that at this stage the free <strong>gas</strong> is the main controller;<br />
2) The <strong>gas</strong> production rate keeps at a stable level. This suggested stable <strong>gas</strong> <strong>hydrate</strong><br />
dissociation due to hot water injection;<br />
3) The <strong>gas</strong> production rate gradually decreased.<br />
<br />
Ga s pr oduction rate ml/min<br />
300<br />
250<br />
200<br />
150<br />
100<br />
50<br />
0<br />
0 30 60 90 120 150 180<br />
Ti me<br />
min<br />
Figure 13. Gas production rate by heat.<br />
<br />
Cu mu l a t i v e g as p r oduced ml<br />
8000<br />
6000<br />
4000<br />
2000<br />
0<br />
0 30 60 90 120 150 180<br />
Ti me<br />
min<br />
Figure 14. Accumulated <strong>gas</strong> by heat.<br />
New Energy Resources in the <strong>CCOP</strong> Region - Gas Hydrates and Coalbed Methane 73