
You also want an ePaper? Increase the reach of your titles
YUMPU automatically turns print PDFs into web optimized ePapers that Google loves.
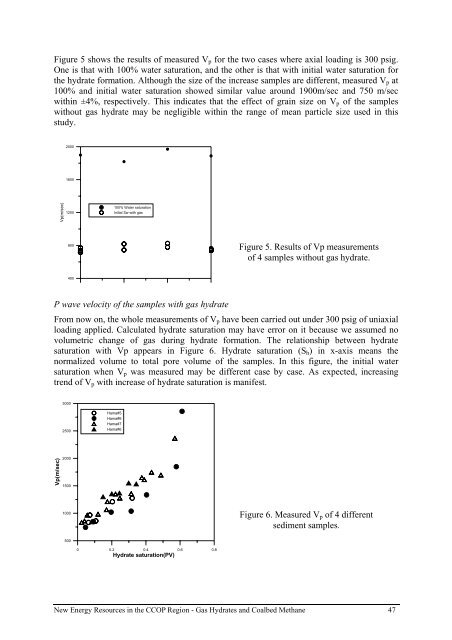
Figure 5 shows the results of measured V p for the two cases where axial loading is 300 psig.<br />
One is that with 100% water saturation, and the other is that with initial water saturation for<br />
the <strong>hydrate</strong> formation. Although the size of the increase samples are different, measured V p at<br />
100% and initial water saturation showed similar value around 1900m/sec and 750 m/sec<br />
within ±4%, respectively. This indicates that the effect of grain size on V p of the samples<br />
without <strong>gas</strong> <strong>hydrate</strong> may be negligible within the range of mean particle size used in this<br />
study.<br />
2000<br />
1600<br />
Vp(m/sec)<br />
1200<br />
100% Water saturation<br />
Initial Sw with <strong>gas</strong><br />
800<br />
Figure 5. Results of Vp measurements<br />
of 4 samples without <strong>gas</strong> <strong>hydrate</strong>.<br />
400<br />
P wave velocity of the samples with <strong>gas</strong> <strong>hydrate</strong><br />
From now on, the whole measurements of V p have been carried out under 300 psig of uniaxial<br />
loading applied. Calculated <strong>hydrate</strong> saturation may have error on it because we assumed no<br />
volumetric change of <strong>gas</strong> during <strong>hydrate</strong> formation. The relationship between <strong>hydrate</strong><br />
saturation with Vp appears in Figure 6. Hydrate saturation (S h ) in x-axis means the<br />
normalized volume to total pore volume of the samples. In this figure, the initial water<br />
saturation when V p was measured may be different case by case. As expected, increasing<br />
trend of V p with increase of <strong>hydrate</strong> saturation is manifest.<br />
3000<br />
2500<br />
Hama#5<br />
Hama#6<br />
Hama#7<br />
Hama#6<br />
Vp(m/sec)<br />
2000<br />
1500<br />
1000<br />
Figure 6. Measured V p of 4 different<br />
sediment samples.<br />
500<br />
0 0.2 0.4 0.6 0.8<br />
Hydrate saturation(PV)<br />
New Energy Resources in the <strong>CCOP</strong> Region - Gas Hydrates and Coalbed Methane 47