Create successful ePaper yourself
Turn your PDF publications into a flip-book with our unique Google optimized e-Paper software.
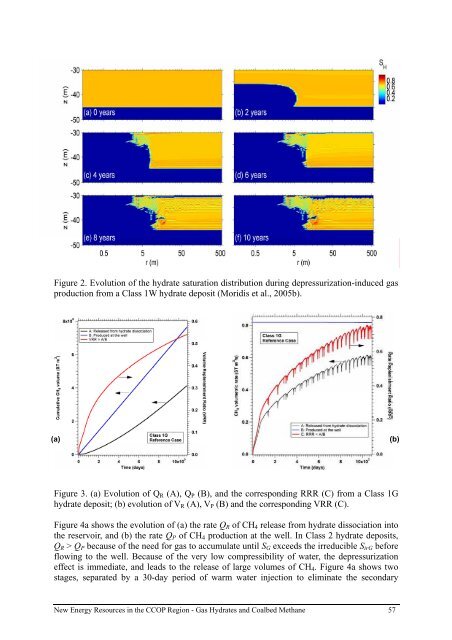
Figure 2. Evolution of the <strong>hydrate</strong> saturation distribution during depressurization-induced <strong>gas</strong><br />
production from a Class 1W <strong>hydrate</strong> deposit (Moridis et al., 2005b).<br />
(a)<br />
(b)<br />
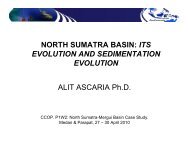
Figure 3. (a) Evolution of Q R (A), Q P (B), and the corresponding RRR (C) from a Class 1G<br />
<strong>hydrate</strong> deposit; (b) evolution of V R (A), V P (B) and the corresponding VRR (C).<br />
Figure 4a shows the evolution of (a) the rate Q R of CH 4 release from <strong>hydrate</strong> dissociation into<br />
the reservoir, and (b) the rate Q P of CH 4 production at the well. In Class 2 <strong>hydrate</strong> deposits,<br />
Q R > Q P because of the need for <strong>gas</strong> to accumulate until S G exceeds the irreducible S irG before<br />
flowing to the well. Because of the very low compressibility of water, the depressurization<br />
effect is immediate, and leads to the release of large volumes of CH 4 . Figure 4a shows two<br />
stages, separated by a 30-day period of warm water injection to eliminate the secondary<br />
New Energy Resources in the <strong>CCOP</strong> Region - Gas Hydrates and Coalbed Methane 57


