
Create successful ePaper yourself
Turn your PDF publications into a flip-book with our unique Google optimized e-Paper software.
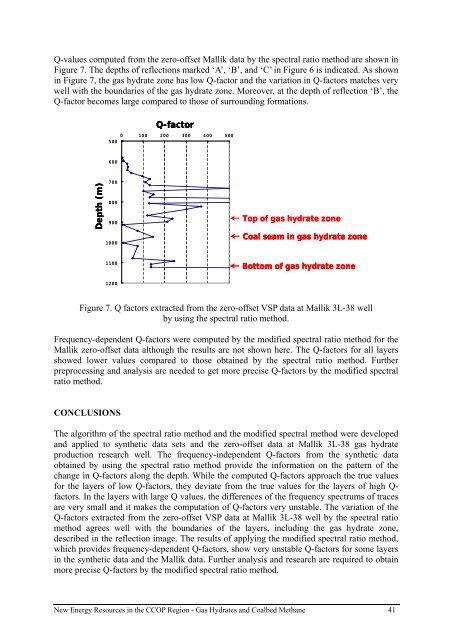
Q-values computed from the zero-offset Mallik data by the spectral ratio method are shown in<br />
Figure 7. The depths of reflections marked ‘A’, ‘B’, and ‘C’ in Figure 6 is indicated. As shown<br />
in Figure 7, the <strong>gas</strong> <strong>hydrate</strong> zone has low Q-factor and the variation in Q-factors matches very<br />
well with the boundaries of the <strong>gas</strong> <strong>hydrate</strong> zone. Moreover, at the depth of reflection ‘B’, the<br />
Q-factor becomes large compared to those of surrounding formations.<br />
Q-factor<br />
0 100 200 300 400 500<br />
500<br />
600<br />
Depth (m)<br />
700<br />
800<br />
900<br />
1000<br />
Top of <strong>gas</strong> <strong>hydrate</strong> zone<br />
Coal seam in <strong>gas</strong> <strong>hydrate</strong> zone<br />
1100<br />
Bottom of <strong>gas</strong> <strong>hydrate</strong> zone<br />
1200<br />
Figure 7. Q factors extracted from the zero-offset VSP data at Mallik 3L-38 well<br />
by using the spectral ratio method.<br />
Frequency-dependent Q-factors were computed by the modified spectral ratio method for the<br />
Mallik zero-offset data although the results are not shown here. The Q-factors for all layers<br />
showed lower values compared to those obtained by the spectral ratio method. Further<br />
preprocessing and analysis are needed to get more precise Q-factors by the modified spectral<br />
ratio method.<br />
CONCLUSIONS<br />
The algorithm of the spectral ratio method and the modified spectral method were developed<br />
and applied to synthetic data sets and the zero-offset data at Mallik 3L-38 <strong>gas</strong> <strong>hydrate</strong><br />
production research well. The frequency-independent Q-factors from the synthetic data<br />
obtained by using the spectral ratio method provide the information on the pattern of the<br />
change in Q-factors along the depth. While the computed Q-factors approach the true values<br />
for the layers of low Q-factors, they deviate from the true values for the layers of high Q-<br />
factors. In the layers with large Q values, the differences of the frequency spectrums of traces<br />
are very small and it makes the computation of Q-factors very unstable. The variation of the<br />
Q-factors extracted from the zero-offset VSP data at Mallik 3L-38 well by the spectral ratio<br />
method agrees well with the boundaries of the layers, including the <strong>gas</strong> <strong>hydrate</strong> zone,<br />
described in the reflection image. The results of applying the modified spectral ratio method,<br />
which provides frequency-dependent Q-factors, show very unstable Q-factors for some layers<br />
in the synthetic data and the Mallik data. Further analysis and research are required to obtain<br />
more precise Q-factors by the modified spectral ratio method.<br />
New Energy Resources in the <strong>CCOP</strong> Region - Gas Hydrates and Coalbed Methane 41