
You also want an ePaper? Increase the reach of your titles
YUMPU automatically turns print PDFs into web optimized ePapers that Google loves.
Q-factor<br />
3000<br />
2500<br />
2000<br />
1500<br />
1000<br />
500<br />
Q-factor<br />
0<br />
30 50 70 90 110 130 150<br />
500<br />
450<br />
400<br />
350<br />
300<br />
250<br />
200<br />
150<br />
100<br />
50<br />
Frequency (Hz)<br />
(a)<br />
0<br />
30 50 70 90 110 130 150<br />
Frequency (Hz)<br />
(c)<br />
500<br />
450<br />
400<br />
350<br />
300<br />
10 m<br />
5 m<br />
250<br />
2 m<br />
200<br />
Model<br />
150<br />
100<br />
50<br />
0<br />
30 50 70 90 110 130 150<br />
10000<br />
9000<br />
8000<br />
7000<br />
6000<br />
10 m<br />
5 m<br />
5000<br />
2 m<br />
4000<br />
Model<br />
3000<br />
2000<br />
1000<br />
Frequency (Hz)<br />
(b)<br />
0<br />
30 50 70 90 110 130 150<br />
Frequency (Hz)<br />
(d)<br />
10 m<br />
5 m<br />
2 m<br />
Model<br />
5 m<br />
2 m<br />
Model<br />
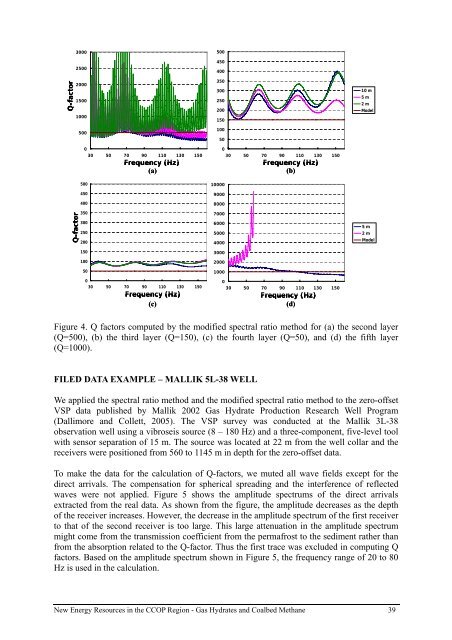
Figure 4. Q factors computed by the modified spectral ratio method for (a) the second layer<br />
(Q=500), (b) the third layer (Q=150), (c) the fourth layer (Q=50), and (d) the fifth layer<br />
(Q=1000).<br />
FILED DATA EXAMPLE – MALLIK 5L-38 WELL<br />
We applied the spectral ratio method and the modified spectral ratio method to the zero-offset<br />
VSP data published by Mallik 2002 Gas Hydrate Production Research Well Program<br />
(Dallimore and Collett, 2005). The VSP survey was conducted at the Mallik 3L-38<br />
observation well using a vibroseis source (8 – 180 Hz) and a three-component, five-level tool<br />
with sensor separation of 15 m. The source was located at 22 m from the well collar and the<br />
receivers were positioned from 560 to 1145 m in depth for the zero-offset data.<br />
To make the data for the calculation of Q-factors, we muted all wave fields except for the<br />
direct arrivals. The compensation for spherical spreading and the interference of reflected<br />
waves were not applied. Figure 5 shows the amplitude spectrums of the direct arrivals<br />
extracted from the real data. As shown from the figure, the amplitude decreases as the depth<br />
of the receiver increases. However, the decrease in the amplitude spectrum of the first receiver<br />
to that of the second receiver is too large. This large attenuation in the amplitude spectrum<br />
might come from the transmission coefficient from the permafrost to the sediment rather than<br />
from the absorption related to the Q-factor. Thus the first trace was excluded in computing Q<br />
factors. Based on the amplitude spectrum shown in Figure 5, the frequency range of 20 to 80<br />
Hz is used in the calculation.<br />
New Energy Resources in the <strong>CCOP</strong> Region - Gas Hydrates and Coalbed Methane 39