
Create successful ePaper yourself
Turn your PDF publications into a flip-book with our unique Google optimized e-Paper software.
0.035<br />
0.03<br />
Amplitude<br />
0.025<br />
0.02<br />
0.015<br />
0.01<br />
0.005<br />
0<br />
0 50 100 150 200 250<br />
Frequency (Hz)<br />
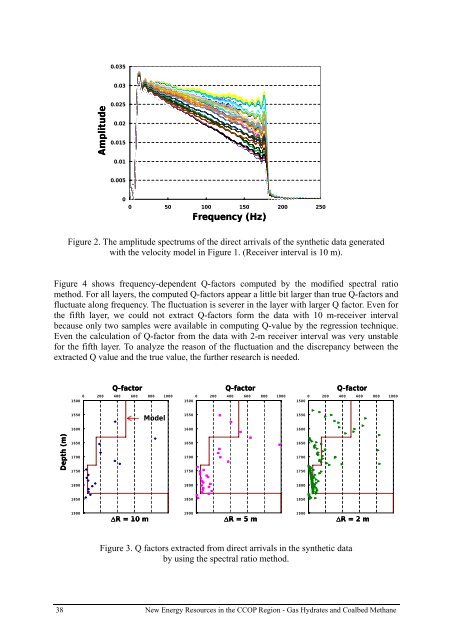
Figure 2. The amplitude spectrums of the direct arrivals of the synthetic data generated<br />
with the velocity model in Figure 1. (Receiver interval is 10 m).<br />
Figure 4 shows frequency-dependent Q-factors computed by the modified spectral ratio<br />
method. For all layers, the computed Q-factors appear a little bit larger than true Q-factors and<br />
fluctuate along frequency. The fluctuation is severer in the layer with larger Q factor. Even for<br />
the fifth layer, we could not extract Q-factors form the data with 10 m-receiver interval<br />
because only two samples were available in computing Q-value by the regression technique.<br />
Even the calculation of Q-factor from the data with 2-m receiver interval was very unstable<br />
for the fifth layer. To analyze the reason of the fluctuation and the discrepancy between the<br />
extracted Q value and the true value, the further research is needed.<br />
Q-factor<br />
0 200 400 600 800 1000<br />
1500<br />
Q-factor<br />
0 200 400 600 800 1000<br />
1500<br />
Q-factor<br />
0 200 400 600 800 1000<br />
1500<br />
1550<br />
Model<br />
1550<br />
1550<br />
1600<br />
1600<br />
1600<br />
Depth (m)<br />
1650<br />
1700<br />
1750<br />
1650<br />
1700<br />
1750<br />
1650<br />
1700<br />
1750<br />
1800<br />
1800<br />
1800<br />
1850<br />
1850<br />
1850<br />
1900<br />
ΔR = 10 m<br />
1900<br />
ΔR = 5 m<br />
1900<br />
ΔR = 2 m<br />
Figure 3. Q factors extracted from direct arrivals in the synthetic data<br />
by using the spectral ratio method.<br />
38<br />
New Energy Resources in the <strong>CCOP</strong> Region - Gas Hydrates and Coalbed Methane