
You also want an ePaper? Increase the reach of your titles
YUMPU automatically turns print PDFs into web optimized ePapers that Google loves.
INJECTED CO 2 MONITORING OF CBM FROM PW-1<br />
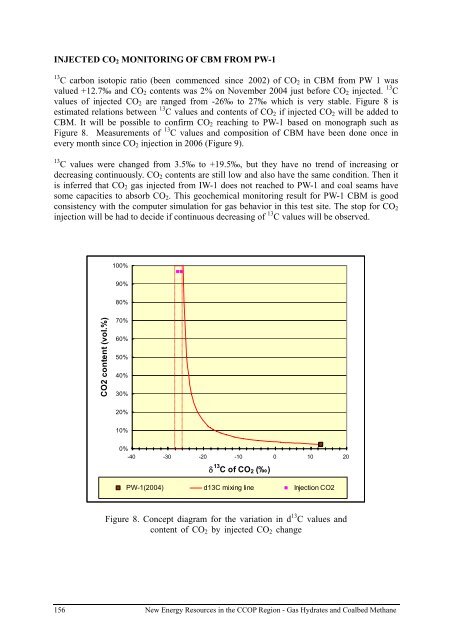
13 C carbon isotopic ratio (been commenced since 2002) of CO 2 in CBM from PW 1 was<br />
valued +12.7‰ and CO 2 contents was 2% on November 2004 just before CO 2 injected. 13 C<br />
values of injected CO 2 are ranged from -26‰ to 27‰ which is very stable. Figure 8 is<br />
estimated relations between 13 C values and contents of CO 2 if injected CO 2 will be added to<br />
CBM. It will be possible to confirm CO 2 reaching to PW-1 based on monograph such as<br />
Figure 8. Measurements of 13 C values and composition of CBM have been done once in<br />
every month since CO 2 injection in 2006 (Figure 9).<br />
13 C values were changed from 3.5‰ to +19.5‰, but they have no trend of increasing or<br />
decreasing continuously. CO 2 contents are still low and also have the same condition. Then it<br />
is inferred that CO 2 <strong>gas</strong> injected from IW-1 does not reached to PW-1 and coal seams have<br />
some capacities to absorb CO 2 . This geochemical monitoring result for PW-1 CBM is good<br />
consistency with the computer simulation for <strong>gas</strong> behavior in this test site. The stop for CO 2<br />
injection will be had to decide if continuous decreasing of 13 C values will be observed.<br />
100%<br />
90%<br />
80%<br />
CO2 content (vol.%)<br />
70%<br />
60%<br />
50%<br />
40%<br />
30%<br />
20%<br />
10%<br />
0%<br />
-40 -30 -20 -10 0 10 20<br />
δ 13 C of CO 2 (‰)<br />
PW-1(2004) d13C mixing line Injection CO2<br />
Figure 8. Concept diagram for the variation in d 13 C values and<br />
content of CO 2 by injected CO 2 change<br />
156 New Energy Resources in the <strong>CCOP</strong> Region - Gas Hydrates and Coalbed Methane