
Create successful ePaper yourself
Turn your PDF publications into a flip-book with our unique Google optimized e-Paper software.
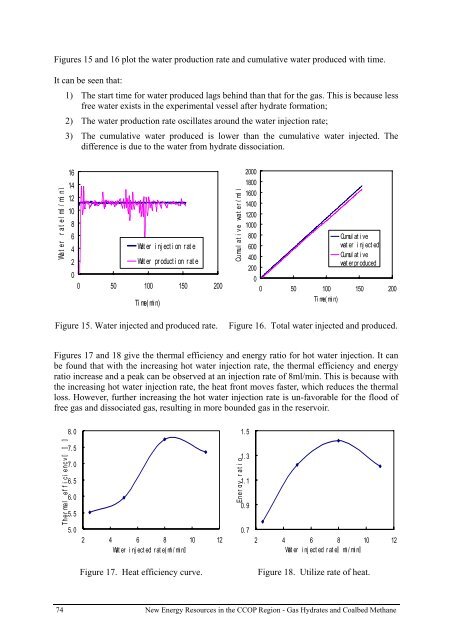
Figures 15 and 16 plot the water production rate and cumulative water produced with time.<br />
It can be seen that:<br />
1) The start time for water produced lags behind than that for the <strong>gas</strong>. This is because less<br />
free water exists in the experimental vessel after <strong>hydrate</strong> formation;<br />
2) The water production rate oscillates around the water injection rate;<br />
3) The cumulative water produced is lower than the cumulative water injected. The<br />
difference is due to the water from <strong>hydrate</strong> dissociation.<br />
Wat er rat e( ml / mi n )<br />
16<br />
14<br />
12<br />
10<br />
8<br />
6<br />
4<br />
Water injection rate<br />
2<br />
Wat er pr oduct i on r at e<br />
0<br />
0 50 100 150 200<br />
Ti me( mi n)<br />
Cumulative water( ml )<br />
2000<br />
1800<br />
1600<br />
1400<br />
1200<br />
1000<br />
800<br />
600<br />
400<br />
200<br />
0<br />
Cumul at i ve<br />
water injected<br />
Cumul at i ve<br />
wat er produced<br />
0 50 100 150 200<br />
Ti me( mi n)<br />
Figure 15. Water injected and produced rate.<br />
Figure 16. Total water injected and produced.<br />
Figures 17 and 18 give the thermal efficiency and energy ratio for hot water injection. It can<br />
be found that with the increasing hot water injection rate, the thermal efficiency and energy<br />
ratio increase and a peak can be observed at an injection rate of 8ml/min. This is because with<br />
the increasing hot water injection rate, the heat front moves faster, which reduces the thermal<br />
loss. However, further increasing the hot water injection rate is un-favorable for the flood of<br />
free <strong>gas</strong> and dissociated <strong>gas</strong>, resulting in more bounded <strong>gas</strong> in the reservoir.<br />
8. 0<br />
1. 5<br />
<br />
Ther mal ef f i ci ency<br />
7. 5<br />
7. 0<br />
6. 5<br />
6. 0<br />
5. 5<br />
5. 0<br />
2 4 6 8 10 12<br />
Wat er i nj ect ed r at e( ml/min<br />
Ener gy ratio<br />
1. 3<br />
1. 1<br />
0. 9<br />
0. 7<br />
2 4 6 8 10 12<br />
Wat er i nj ect ed r at e<br />
ml/min<br />
Figure 17. Heat efficiency curve.<br />
Figure 18. Utilize rate of heat.<br />
74<br />
New Energy Resources in the <strong>CCOP</strong> Region - Gas Hydrates and Coalbed Methane