CFSP 5 Year Plan - RI Department of Children, Youth & Families
CFSP 5 Year Plan - RI Department of Children, Youth & Families
CFSP 5 Year Plan - RI Department of Children, Youth & Families

Create successful ePaper yourself
Turn your PDF publications into a flip-book with our unique Google optimized e-Paper software.
Measure<br />
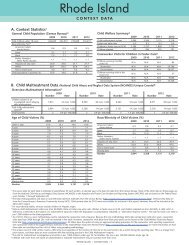
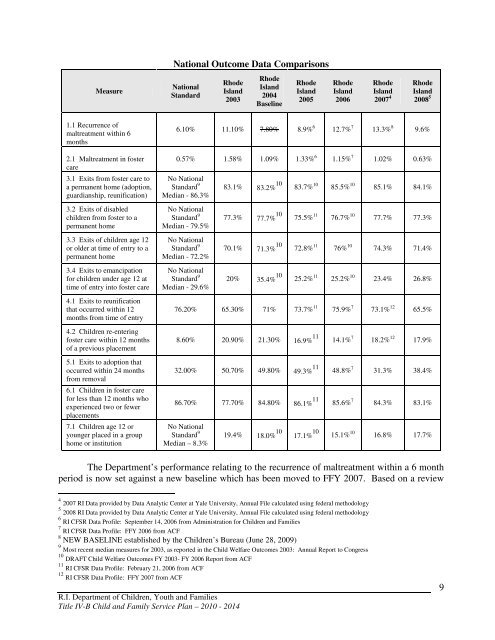
National Outcome Data Comparisons<br />
National<br />
Standard<br />
Rhode<br />
Island<br />
2003<br />
Rhode<br />
Island<br />
2004<br />
Baseline<br />
Rhode<br />
Island<br />
2005<br />
Rhode<br />
Island<br />
2006<br />
Rhode<br />
Rhode<br />
2007 4 2008 5<br />
Island Island<br />
1.1 Recurrence <strong>of</strong><br />
maltreatment within 6<br />
months<br />
2.1 Maltreatment in foster<br />
care<br />
3.1 Exits from foster care to<br />
a permanent home (adoption,<br />
guardianship, reunification)<br />
3.2 Exits <strong>of</strong> disabled<br />
children from foster to a<br />
permanent home<br />
3.3 Exits <strong>of</strong> children age 12<br />
or older at time <strong>of</strong> entry to a<br />
permanent home<br />
3.4 Exits to emancipation<br />
for children under age 12 at<br />
time <strong>of</strong> entry into foster care<br />
4.1 Exits to reunification<br />
that occurred within 12<br />
months from time <strong>of</strong> entry<br />
4.2 <strong>Children</strong> re-entering<br />
foster care within 12 months<br />
<strong>of</strong> a previous placement<br />
5.1 Exits to adoption that<br />
occurred within 24 months<br />
from removal<br />
6.1 <strong>Children</strong> in foster care<br />
for less than 12 months who<br />
experienced two or fewer<br />
placements<br />
7.1 <strong>Children</strong> age 12 or<br />
younger placed in a group<br />
home or institution<br />
6.10% 11.10% 7.80% 8.9% 6 12.7% 7 13.3% 8 9.6%<br />
0.57% 1.58% 1.09% 1.33% 6 1.15% 7 1.02% 0.63%<br />
No National<br />
Standard 9<br />
Median - 86.3%<br />
No National<br />
Standard 9<br />
Median - 79.5%<br />
No National<br />
Standard 9<br />
Median - 72.2%<br />
No National<br />
Standard 9<br />
Median - 29.6%<br />
83.1% 83.2% 10 83.7% 10 85.5% 10 85.1% 84.1%<br />
77.3% 77.7% 10 75.5% 11 76.7% 10 77.7% 77.3%<br />
70.1% 71.3% 10 72.8% 11 76% 10 74.3% 71.4%<br />
20% 35.4% 10 25.2% 11 25.2% 10 23.4% 26.8%<br />
76.20% 65.30% 71% 73.7% 11 75.9% 7 73.1% 12 65.5%<br />
8.60% 20.90% 21.30% 16.9% 11 14.1% 7 18.2% 12 17.9%<br />
32.00% 50.70% 49.80% 49.3% 11 48.8% 7 31.3% 38.4%<br />
86.70% 77.70% 84.80% 86.1% 11 85.6% 7 84.3% 83.1%<br />
No National<br />
Standard 9<br />
Median – 8.3%<br />
19.4% 18.0% 10 17.1% 10 15.1% 10 16.8% 17.7%<br />
The <strong>Department</strong>’s performance relating to the recurrence <strong>of</strong> maltreatment within a 6 month<br />
period is now set against a new baseline which has been moved to FFY 2007. Based on a review<br />
4 2007 <strong>RI</strong> Data provided by Data Analytic Center at Yale University, Annual File calculated using federal methodology<br />
5 2008 <strong>RI</strong> Data provided by Data Analytic Center at Yale University, Annual File calculated using federal methodology<br />
6 <strong>RI</strong> CFSR Data Pr<strong>of</strong>ile: September 14, 2006 from Administration for <strong>Children</strong> and <strong>Families</strong><br />
7 <strong>RI</strong> CFSR Data Pr<strong>of</strong>ile: FFY 2006 from ACF<br />
8 NEW BASELINE established by the <strong>Children</strong>’s Bureau (June 28, 2009)<br />
9 Most recent median measures for 2003, as reported in the Child Welfare Outcomes 2003: Annual Report to Congress<br />
10 DRAFT Child Welfare Outcomes FY 2003- FY 2006 Report from ACF<br />
11 <strong>RI</strong> CFSR Data Pr<strong>of</strong>ile: February 21, 2006 from ACF<br />
12 <strong>RI</strong> CFSR Data Pr<strong>of</strong>ile: FFY 2007 from ACF<br />
R.I. <strong>Department</strong> <strong>of</strong> <strong>Children</strong>, <strong>Youth</strong> and <strong>Families</strong><br />
Title IV-B Child and Family Service <strong>Plan</strong> – 2010 - 2014<br />
9