CFSP 5 Year Plan - RI Department of Children, Youth & Families
CFSP 5 Year Plan - RI Department of Children, Youth & Families
CFSP 5 Year Plan - RI Department of Children, Youth & Families

You also want an ePaper? Increase the reach of your titles
YUMPU automatically turns print PDFs into web optimized ePapers that Google loves.
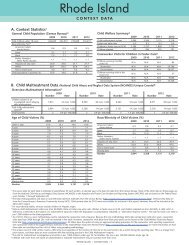
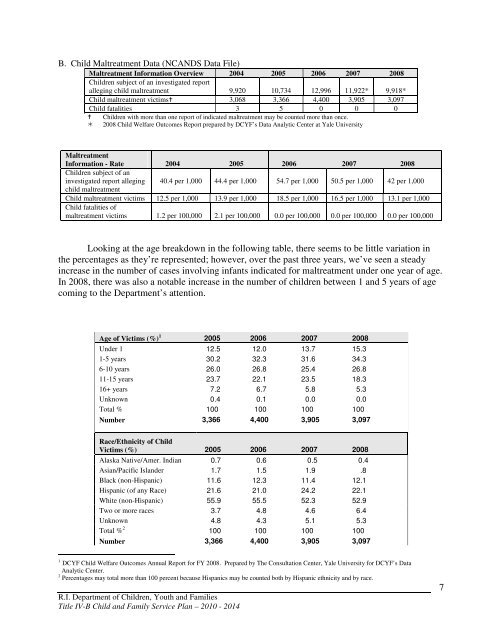
B. Child Maltreatment Data (NCANDS Data File)<br />
Maltreatment Information Overview 2004 2005 2006 2007 2008<br />
<strong>Children</strong> subject <strong>of</strong> an investigated report<br />
alleging child maltreatment 9,920 10,734 12,996 11,922* 9,918*<br />
Child maltreatment victims 3,068 3,366 4,400 3,905 3,097<br />
Child fatalities 3 5 0 0 0<br />
<strong>Children</strong> with more than one report <strong>of</strong> indicated maltreatment may be counted more than once.<br />
2008 Child Welfare Outcomes Report prepared by DCYF’s Data Analytic Center at Yale University<br />
Maltreatment<br />
Information - Rate 2004 2005 2006 2007 2008<br />
<strong>Children</strong> subject <strong>of</strong> an<br />
investigated report alleging 40.4 per 1,000 44.4 per 1,000 54.7 per 1,000 50.5 per 1,000 42 per 1,000<br />
child maltreatment<br />
Child maltreatment victims 12.5 per 1,000 13.9 per 1,000 18.5 per 1,000 16.5 per 1,000 13.1 per 1,000<br />
Child fatalities <strong>of</strong><br />
maltreatment victims 1.2 per 100,000 2.1 per 100,000 0.0 per 100,000 0.0 per 100,000 0.0 per 100,000<br />
Looking at the age breakdown in the following table, there seems to be little variation in<br />
the percentages as they’re represented; however, over the past three years, we’ve seen a steady<br />
increase in the number <strong>of</strong> cases involving infants indicated for maltreatment under one year <strong>of</strong> age.<br />
In 2008, there was also a notable increase in the number <strong>of</strong> children between 1 and 5 years <strong>of</strong> age<br />
coming to the <strong>Department</strong>’s attention.<br />
Age <strong>of</strong> Victims (%) 1 2005 2006 2007 2008<br />
Under 1 12.5 12.0 13.7 15.3<br />
1-5 years 30.2 32.3 31.6 34.3<br />
6-10 years 26.0 26.8 25.4 26.8<br />
11-15 years 23.7 22.1 23.5 18.3<br />
16+ years 7.2 6.7 5.8 5.3<br />
Unknown 0.4 0.1 0.0 0.0<br />
Total % 100 100 100 100<br />
Number 3,366 4,400 3,905 3,097<br />
Race/Ethnicity <strong>of</strong> Child<br />
Victims (%) 2005 2006 2007 2008<br />
Alaska Native/Amer. Indian 0.7 0.6 0.5 0.4<br />
Asian/Pacific Islander 1.7 1.5 1.9 .8<br />
Black (non-Hispanic) 11.6 12.3 11.4 12.1<br />
Hispanic (<strong>of</strong> any Race) 21.6 21.0 24.2 22.1<br />
White (non-Hispanic) 55.9 55.5 52.3 52.9<br />
Two or more races 3.7 4.8 4.6 6.4<br />
Unknown 4.8 4.3 5.1 5.3<br />
Total % 2 100 100 100 100<br />
Number 3,366 4,400 3,905 3,097<br />
1<br />
DCYF Child Welfare Outcomes Annual Report for FY 2008. Prepared by The Consultation Center, Yale University for DCYF’s Data<br />
Analytic Center.<br />
2 Percentages may total more than 100 percent because Hispanics may be counted both by Hispanic ethnicity and by race.<br />
R.I. <strong>Department</strong> <strong>of</strong> <strong>Children</strong>, <strong>Youth</strong> and <strong>Families</strong><br />
Title IV-B Child and Family Service <strong>Plan</strong> – 2010 - 2014<br />
7