

East Midlands Regional Spatial Strategy 2005/06
East Midlands Regional Spatial Strategy 2005/06
East Midlands Regional Spatial Strategy 2005/06

Create successful ePaper yourself
Turn your PDF publications into a flip-book with our unique Google optimized e-Paper software.
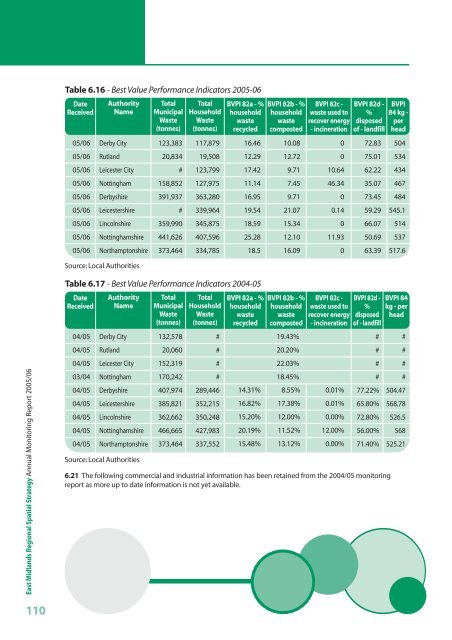
Table 6.16 - Best Value Performance Indicators <strong>2005</strong>-<strong>06</strong><br />
Date<br />
Received<br />
05/<strong>06</strong><br />
05/<strong>06</strong><br />
05/<strong>06</strong><br />
05/<strong>06</strong><br />
05/<strong>06</strong><br />
05/<strong>06</strong><br />
05/<strong>06</strong><br />
05/<strong>06</strong><br />
05/<strong>06</strong><br />
Authority<br />
Name<br />
Derby City<br />
Rutland<br />
Leicester City<br />
Nottingham<br />
Derbyshire<br />
Leicestershire<br />
Lincolnshire<br />
Nottinghamshire<br />
Northamptonshire<br />
Total<br />
Municipal<br />
Waste<br />
(tonnes)<br />
123,383<br />
20,834<br />
#<br />
158,852<br />
391,937<br />
#<br />
359,990<br />
441,626<br />
373,464<br />
Total<br />
Household<br />
Waste<br />
(tonnes)<br />
117,879<br />
19,508<br />
123,799<br />
127,975<br />
363,280<br />
339,964<br />
345,875<br />
407,596<br />
334,785<br />
BVPI 82a - %<br />
household<br />
waste<br />
recycled<br />
16.46<br />
12.29<br />
17.42<br />
11.14<br />
16.95<br />
19.54<br />
18.59<br />
25.28<br />
18.5<br />
BVPI 82b - %<br />
household<br />
waste<br />
composted<br />
10.08<br />
12.72<br />
9.71<br />
7.45<br />
9.71<br />
21.07<br />
15.34<br />
12.10<br />
16.09<br />
BVPI 82c -<br />
waste used to<br />
recover energy<br />
- incineration<br />
0<br />
0<br />
10.64<br />
46.34<br />
0<br />
0.14<br />
0<br />
11.93<br />
0<br />
BVPI 82d -<br />
%<br />
disposed<br />
of - landfill<br />
72.83<br />
75.01<br />
62.22<br />
35.07<br />
73.45<br />
59.29<br />
66.07<br />
50.69<br />
63.39<br />
BVPI<br />
84 kg -<br />
per<br />
head<br />
504<br />
534<br />
434<br />
467<br />
484<br />
545.1<br />
514<br />
537<br />
517.6<br />
Source: Local Authorities<br />
<strong>East</strong> <strong>Midlands</strong> <strong>Regional</strong> <strong>Spatial</strong> <strong>Strategy</strong> Annual Monitoring Report <strong>2005</strong>/<strong>06</strong><br />
Table 6.17 - Best Value Performance Indicators 2004-05<br />
Date<br />
Received<br />
04/05<br />
04/05<br />
04/05<br />
03/04<br />
04/05<br />
04/05<br />
04/05<br />
04/05<br />
04/05<br />
Authority<br />
Name<br />
Derby City<br />
Rutland<br />
Leicester City<br />
Nottingham<br />
Derbyshire<br />
Leicestershire<br />
Lincolnshire<br />
Nottinghamshire<br />
Northamptonshire<br />
Source: Local Authorities<br />
Total<br />
Municipal<br />
Waste<br />
(tonnes)<br />
132,578<br />
20,<strong>06</strong>0<br />
152,319<br />
170,242<br />
407,974<br />
385,821<br />
362,662<br />
466,665<br />
373,464<br />
Total<br />
Household<br />
Waste<br />
(tonnes)<br />
#<br />
#<br />
#<br />
#<br />
289,446<br />
352,215<br />
350,248<br />
427,983<br />
337,552<br />
BVPI 82a - %<br />
household<br />
waste<br />
recycled<br />
14.31%<br />
16.82%<br />
15.20%<br />
20.19%<br />
15.48%<br />
BVPI 82b - %<br />
household<br />
waste<br />
composted<br />
19.43%<br />
20.20%<br />
22.03%<br />
18.45%<br />
8.55%<br />
17.38%<br />
12.00%<br />
11.52%<br />
13.12%<br />
BVPI 82c -<br />
waste used to<br />
recover energy<br />
- incineration<br />
0.01%<br />
0.01%<br />
0.00%<br />
12.00%<br />
0.00%<br />
BVPI 82d -<br />
%<br />
disposed<br />
of - landfill<br />
#<br />
#<br />
#<br />
#<br />
77.22%<br />
65.80%<br />
72.80%<br />
56.00%<br />
71.40%<br />
6.21 The following commercial and industrial information has been retained from the 2004/05 monitoring<br />
report as more up to date information is not yet available.<br />
BVPI 84<br />
kg - per<br />
head<br />
#<br />
#<br />
#<br />
#<br />
504.47<br />
568.78<br />
526.5<br />
568<br />
525.21<br />
110


