

East Midlands Regional Spatial Strategy 2005/06
East Midlands Regional Spatial Strategy 2005/06
East Midlands Regional Spatial Strategy 2005/06

Create successful ePaper yourself
Turn your PDF publications into a flip-book with our unique Google optimized e-Paper software.
Data Issues<br />
5.2 Where possible indicators are shown that<br />
compare the <strong>East</strong> <strong>Midlands</strong> with other regions of the<br />
UK and intra-regionally. However, in many cases data<br />
is not available at the intra regional level. In addition,<br />
and where available, changes in data over time have<br />
been presented although consistent time series data<br />
is not always available.<br />
5.3 A number of data issues were raised in the<br />
2004/05 Annual Monitoring Report (AMR) which<br />
have been addressed in assembling the data for the<br />
<strong>2005</strong>/<strong>06</strong> Report. For example the questionnaire used<br />
to collect information on Sustainable Drainage<br />
Schemes (SuDS) requested information on sites<br />
rather than dwellings. More authorities had<br />
completed a Landscape Character Assessment and a<br />
number indicated they were in the process of<br />
undertaking such an Assessment. Such work in<br />
progress is not always picked up in the indicator<br />
definitions.<br />
5.4 Much of the information gathered comes from<br />
secondary sources and from information provided by<br />
organisations such as the Environment Agency.<br />
There are still some indicators where information is<br />
difficult to obtain e.g. data on the area of new<br />
woodland created.<br />
5.5 Issues remain regarding the definition of some<br />
indicators and whether they are either logical in the<br />
way that they are formulated or measure the impact<br />
of the policy concerned.<br />
5.6 Some indicators are defined in terms of the cases<br />
or case studies rather than in quantitative terms.<br />
While the use of specific examples provides valuable<br />
qualitative information it is not clear how such<br />
qualitative indicators can be used for general<br />
comparisons or for time series analysis.<br />
Policy 27: Protecting and Enhancing the<br />
Region’s Natural and Cultural Assets<br />
The cultural assets of the region include listed<br />
buildings, conservation areas, historic parks and<br />
gardens, registered battlefields and scheduled<br />
ancient monuments<br />
Targets:<br />
• No net loss of natural or cultural assets<br />
• The Government’s Public Service Agreement (PSA)<br />
target is to have 95% of the Sites of Special Scientific<br />
Interest (SSSI) areas in favourable or recovering<br />
condition by 2010<br />
Indicators:<br />
• Cases of damage to natural and cultural assets and<br />
compensatory measures<br />
• Improvements in the condition of land classified as<br />
SSSI<br />
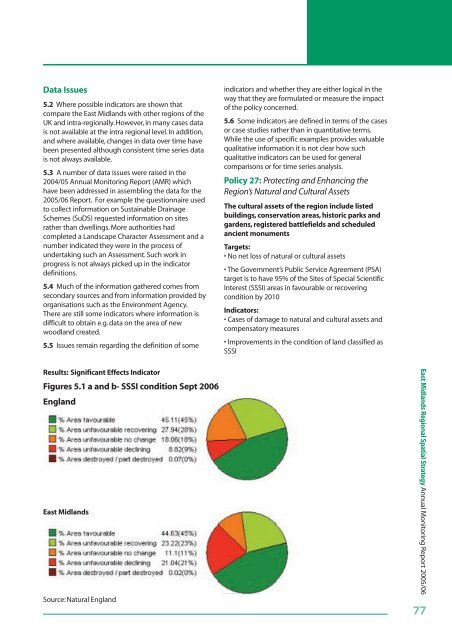
Results: Significant Effects Indicator<br />
Figures 5.1 a and b- SSSI condition Sept 20<strong>06</strong><br />
England<br />
<strong>East</strong> <strong>Midlands</strong><br />
Source: Natural England<br />
<strong>East</strong> <strong>Midlands</strong> <strong>Regional</strong> <strong>Spatial</strong> <strong>Strategy</strong> Annual Monitoring Report <strong>2005</strong>/<strong>06</strong><br />
77


