

East Midlands Regional Spatial Strategy 2005/06
East Midlands Regional Spatial Strategy 2005/06
East Midlands Regional Spatial Strategy 2005/06

Create successful ePaper yourself
Turn your PDF publications into a flip-book with our unique Google optimized e-Paper software.
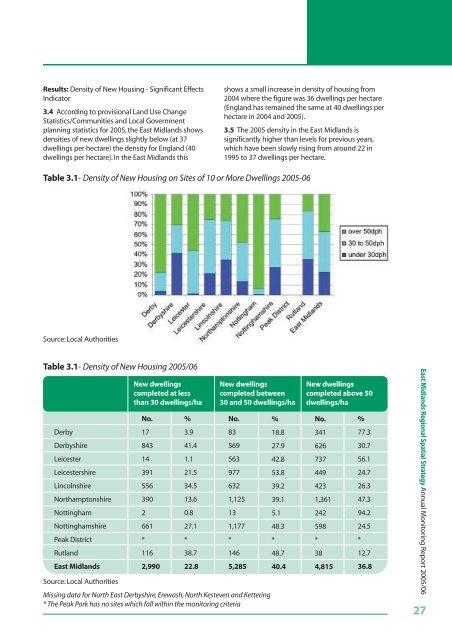
Results: Density of New Housing - Significant Effects<br />
Indicator<br />
3.4 According to provisional Land Use Change<br />
Statistics/Communities and Local Government<br />
planning statistics for <strong>2005</strong>, the <strong>East</strong> <strong>Midlands</strong> shows<br />
densities of new dwellings slightly below (at 37<br />
dwellings per hectare) the density for England (40<br />
dwellings per hectare). In the <strong>East</strong> <strong>Midlands</strong> this<br />
shows a small increase in density of housing from<br />
2004 where the figure was 36 dwellings per hectare<br />
(England has remained the same at 40 dwellings per<br />
hectare in 2004 and <strong>2005</strong>).<br />
3.5 The <strong>2005</strong> density in the <strong>East</strong> <strong>Midlands</strong> is<br />
significantly higher than levels for previous years,<br />
which have been slowly rising from around 22 in<br />
1995 to 37 dwellings per hectare.<br />
Table 3.1- Density of New Housing on Sites of 10 or More Dwellings <strong>2005</strong>-<strong>06</strong><br />
Source: Local Authorities<br />
Table 3.1- Density of New Housing <strong>2005</strong>/<strong>06</strong><br />
Derby<br />
Derbyshire<br />
Leicester<br />
Leicestershire<br />
Lincolnshire<br />
Northamptonshire<br />
Nottingham<br />
Nottinghamshire<br />
Peak District<br />
Rutland<br />
<strong>East</strong> <strong>Midlands</strong><br />
New dwellings<br />
completed at less<br />
than 30 dwellings/ha<br />
No.<br />
17<br />
843<br />
14<br />
391<br />
556<br />
390<br />
2<br />
661<br />
*<br />
116<br />
2,990<br />
%<br />
3.9<br />
41.4<br />
1.1<br />
21.5<br />
34.5<br />
13.6<br />
0.8<br />
27.1<br />
*<br />
38.7<br />
22.8<br />
New dwellings<br />
completed between<br />
30 and 50 dwellings/ha<br />
No.<br />
83<br />
569<br />
563<br />
977<br />
632<br />
1,125<br />
13<br />
1,177<br />
*<br />
146<br />
5,285<br />
Source: Local Authorities<br />
Missing data for North <strong>East</strong> Derbyshire, Erewash, North Kesteven and Kettering<br />
* The Peak Park has no sites which fall within the monitoring criteria<br />
%<br />
18.8<br />
27.9<br />
42.8<br />
53.8<br />
39.2<br />
39.1<br />
5.1<br />
48.3<br />
*<br />
48.7<br />
40.4<br />
New dwellings<br />
completed above 50<br />
dwellings/ha<br />
No.<br />
341<br />
626<br />
737<br />
449<br />
423<br />
1,361<br />
242<br />
598<br />
*<br />
38<br />
4,815<br />
%<br />
77.3<br />
30.7<br />
56.1<br />
24.7<br />
26.3<br />
47.3<br />
94.2<br />
24.5<br />
*<br />
12.7<br />
36.8<br />
<strong>East</strong> <strong>Midlands</strong> <strong>Regional</strong> <strong>Spatial</strong> <strong>Strategy</strong> Annual Monitoring Report <strong>2005</strong>/<strong>06</strong><br />
27


