

East Midlands Regional Spatial Strategy 2005/06
East Midlands Regional Spatial Strategy 2005/06
East Midlands Regional Spatial Strategy 2005/06

You also want an ePaper? Increase the reach of your titles
YUMPU automatically turns print PDFs into web optimized ePapers that Google loves.
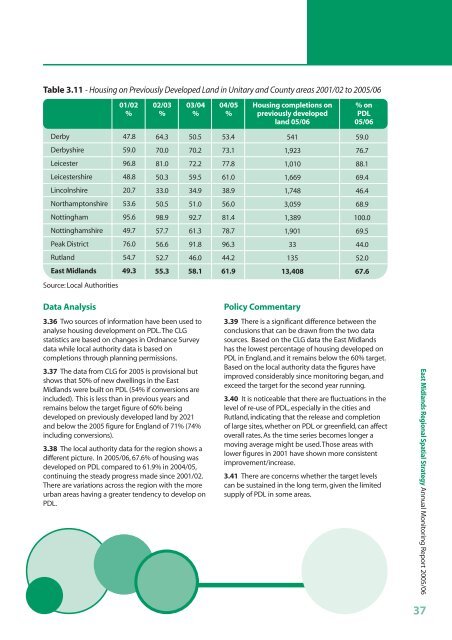
Table 3.11 - Housing on Previously Developed Land in Unitary and County areas 2001/02 to <strong>2005</strong>/<strong>06</strong><br />
01/02<br />
%<br />
02/03<br />
%<br />
03/04<br />
%<br />
04/05<br />
%<br />
Housing completions on<br />
previously developed<br />
land 05/<strong>06</strong><br />
% on<br />
PDL<br />
05/<strong>06</strong><br />
Derby<br />
47.8<br />
64.3<br />
50.5<br />
53.4<br />
541<br />
59.0<br />
Derbyshire<br />
59.0<br />
70.0<br />
70.2<br />
73.1<br />
1,923<br />
76.7<br />
Leicester<br />
96.8<br />
81.0<br />
72.2<br />
77.8<br />
1,010<br />
88.1<br />
Leicestershire<br />
48.8<br />
50.3<br />
59.5<br />
61.0<br />
1,669<br />
69.4<br />
Lincolnshire<br />
20.7<br />
33.0<br />
34.9<br />
38.9<br />
1,748<br />
46.4<br />
Northamptonshire<br />
53.6<br />
50.5<br />
51.0<br />
56.0<br />
3,059<br />
68.9<br />
Nottingham<br />
95.6<br />
98.9<br />
92.7<br />
81.4<br />
1,389<br />
100.0<br />
Nottinghamshire<br />
49.7<br />
57.7<br />
61.3<br />
78.7<br />
1,901<br />
69.5<br />
Peak District<br />
76.0<br />
56.6<br />
91.8<br />
96.3<br />
33<br />
44.0<br />
Rutland<br />
54.7<br />
52.7<br />
46.0<br />
44.2<br />
135<br />
52.0<br />
<strong>East</strong> <strong>Midlands</strong><br />
49.3<br />
55.3<br />
58.1<br />
61.9<br />
13,408<br />
67.6<br />
Source: Local Authorities<br />
Data Analysis<br />
3.36 Two sources of information have been used to<br />
analyse housing development on PDL.The CLG<br />
statistics are based on changes in Ordnance Survey<br />
data while local authority data is based on<br />
completions through planning permissions.<br />
3.37 The data from CLG for <strong>2005</strong> is provisional but<br />
shows that 50% of new dwellings in the <strong>East</strong><br />
<strong>Midlands</strong> were built on PDL (54% if conversions are<br />
included). This is less than in previous years and<br />
remains below the target figure of 60% being<br />
developed on previously developed land by 2021<br />
and below the <strong>2005</strong> figure for England of 71% (74%<br />
including conversions).<br />
3.38 The local authority data for the region shows a<br />
different picture. In <strong>2005</strong>/<strong>06</strong>, 67.6% of housing was<br />
developed on PDL compared to 61.9% in 2004/05,<br />
continuing the steady progress made since 2001/02.<br />
There are variations across the region with the more<br />
urban areas having a greater tendency to develop on<br />
PDL.<br />
Policy Commentary<br />
3.39 There is a significant difference between the<br />
conclusions that can be drawn from the two data<br />
sources. Based on the CLG data the <strong>East</strong> <strong>Midlands</strong><br />
has the lowest percentage of housing developed on<br />
PDL in England, and it remains below the 60% target.<br />
Based on the local authority data the figures have<br />
improved considerably since monitoring began, and<br />
exceed the target for the second year running.<br />
3.40 It is noticeable that there are fluctuations in the<br />
level of re-use of PDL, especially in the cities and<br />
Rutland, indicating that the release and completion<br />
of large sites, whether on PDL or greenfield, can affect<br />
overall rates. As the time series becomes longer a<br />
moving average might be used.Those areas with<br />
lower figures in 2001 have shown more consistent<br />
improvement/increase.<br />
3.41 There are concerns whether the target levels<br />
can be sustained in the long term, given the limited<br />
supply of PDL in some areas.<br />
<strong>East</strong> <strong>Midlands</strong> <strong>Regional</strong> <strong>Spatial</strong> <strong>Strategy</strong> Annual Monitoring Report <strong>2005</strong>/<strong>06</strong><br />
37


