

East Midlands Regional Spatial Strategy 2005/06
East Midlands Regional Spatial Strategy 2005/06
East Midlands Regional Spatial Strategy 2005/06

Create successful ePaper yourself
Turn your PDF publications into a flip-book with our unique Google optimized e-Paper software.
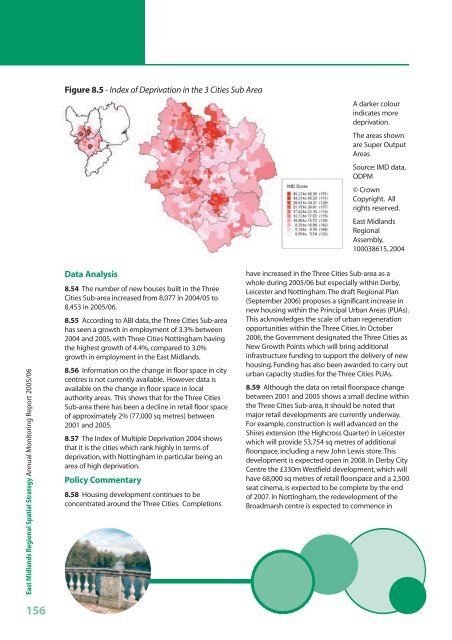
Figure 8.5 - Index of Deprivation in the 3 Cities Sub Area<br />
A darker colour<br />
indicates more<br />
deprivation.<br />
The areas shown<br />
are Super Output<br />
Areas<br />
Source: IMD data,<br />
ODPM<br />
© Crown<br />
Copyright. All<br />
rights reserved.<br />
<strong>East</strong> <strong>Midlands</strong><br />
<strong>Regional</strong><br />
Assembly,<br />
100038615, 2004<br />
<strong>East</strong> <strong>Midlands</strong> <strong>Regional</strong> <strong>Spatial</strong> <strong>Strategy</strong> Annual Monitoring Report <strong>2005</strong>/<strong>06</strong><br />
Data Analysis<br />
8.54 The number of new houses built in the Three<br />
Cities Sub-area increased from 8,077 in 2004/05 to<br />
8,453 in <strong>2005</strong>/<strong>06</strong>.<br />
8.55 According to ABI data, the Three Cities Sub-area<br />
has seen a growth in employment of 3.3% between<br />
2004 and <strong>2005</strong>, with Three Cities Nottingham having<br />
the highest growth of 4.4%, compared to 3.0%<br />
growth in employment in the <strong>East</strong> <strong>Midlands</strong>.<br />
8.56 Information on the change in floor space in city<br />
centres is not currently available. However data is<br />
available on the change in floor space in local<br />
authority areas. This shows that for the Three Cities<br />
Sub-area there has been a decline in retail floor space<br />
of approximately 2% (77,000 sq metres) between<br />
2001 and <strong>2005</strong>.<br />
8.57 The Index of Multiple Deprivation 2004 shows<br />
that it is the cities which rank highly in terms of<br />
deprivation, with Nottingham in particular being an<br />
area of high deprivation.<br />
Policy Commentary<br />
8.58 Housing development continues to be<br />
concentrated around the Three Cities. Completions<br />
have increased in the Three Cities Sub-area as a<br />
whole during <strong>2005</strong>/<strong>06</strong> but especially within Derby,<br />
Leicester and Nottingham.The draft <strong>Regional</strong> Plan<br />
(September 20<strong>06</strong>) proposes a significant increase in<br />
new housing within the Principal Urban Areas (PUAs).<br />
This acknowledges the scale of urban regeneration<br />
opportunities within the Three Cities. In October<br />
20<strong>06</strong>, the Government designated the Three Cities as<br />
New Growth Points which will bring additional<br />
infrastructure funding to support the delivery of new<br />
housing. Funding has also been awarded to carry out<br />
urban capacity studies for the Three Cities PUAs.<br />
8.59 Although the data on retail floorspace change<br />
between 2001 and <strong>2005</strong> shows a small decline within<br />
the Three Cities Sub-area, it should be noted that<br />
major retail developments are currently underway.<br />
For example, construction is well advanced on the<br />
Shires extension (the Highcross Quarter) in Leicester<br />
which will provide 53,754 sq metres of additional<br />
floorspace, including a new John Lewis store.This<br />
development is expected open in 2008. In Derby City<br />
Centre the £330m Westfield development, which will<br />
have 68,000 sq metres of retail floorspace and a 2,500<br />
seat cinema, is expected to be complete by the end<br />
of 2007. In Nottingham, the redevelopment of the<br />
Broadmarsh centre is expected to commence in<br />
156


