East Midlands Regional Spatial Strategy 2005/06
East Midlands Regional Spatial Strategy 2005/06
East Midlands Regional Spatial Strategy 2005/06
Create successful ePaper yourself
Turn your PDF publications into a flip-book with our unique Google optimized e-Paper software.
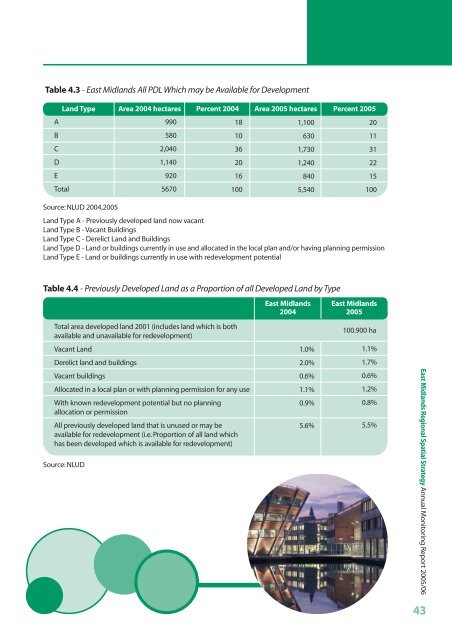
Table 4.3 - <strong>East</strong> <strong>Midlands</strong> All PDL Which may be Available for Development<br />
A<br />
B<br />
C<br />
D<br />
E<br />
Total<br />
Land Type Area 2004 hectares Percent 2004 Area <strong>2005</strong> hectares Percent <strong>2005</strong><br />
990<br />
580<br />
2,040<br />
1,140<br />
920<br />
5670<br />
18<br />
10<br />
36<br />
20<br />
16<br />
100<br />
1,100<br />
630<br />
1,730<br />
1,240<br />
840<br />
5,540<br />
Source: NLUD 2004,<strong>2005</strong><br />
Land Type A - Previously developed land now vacant<br />
Land Type B - Vacant Buildings<br />
Land Type C - Derelict Land and Buildings<br />
Land Type D - Land or buildings currently in use and allocated in the local plan and/or having planning permission<br />
Land Type E - Land or buildings currently in use with redevelopment potential<br />
20<br />
11<br />
31<br />
22<br />
15<br />
100<br />
Table 4.4 - Previously Developed Land as a Proportion of all Developed Land by Type<br />
<strong>East</strong> <strong>Midlands</strong><br />
2004<br />
<strong>East</strong> <strong>Midlands</strong><br />
<strong>2005</strong><br />
Total area developed land 2001 (includes land which is both<br />
available and unavailable for redevelopment)<br />
100.900 ha<br />
Vacant Land<br />
1.0%<br />
1.1%<br />
Derelict land and buildings<br />
2.0%<br />
1.7%<br />
Vacant buildings<br />
Allocated in a local plan or with planning permission for any use<br />
With known redevelopment potential but no planning<br />
allocation or permission<br />
All previously developed land that is unused or may be<br />
available for redevelopment (i.e. Proportion of all land which<br />
has been developed which is available for redevelopment)<br />
Source: NLUD<br />
0.6%<br />
1.1%<br />
0.9%<br />
5.6%<br />
0.6%<br />
1.2%<br />
0.8%<br />
5.5%<br />
<strong>East</strong> <strong>Midlands</strong> <strong>Regional</strong> <strong>Spatial</strong> <strong>Strategy</strong> Annual Monitoring Report <strong>2005</strong>/<strong>06</strong><br />
43


