East Midlands Regional Spatial Strategy 2005/06
East Midlands Regional Spatial Strategy 2005/06
East Midlands Regional Spatial Strategy 2005/06
You also want an ePaper? Increase the reach of your titles
YUMPU automatically turns print PDFs into web optimized ePapers that Google loves.
<strong>East</strong> <strong>Midlands</strong> <strong>Regional</strong> <strong>Spatial</strong> <strong>Strategy</strong> Annual Monitoring Report <strong>2005</strong>/<strong>06</strong><br />
Data Analysis<br />
4.71 The number of new VAT registration in the <strong>East</strong><br />
<strong>Midlands</strong> fell marginally from 12,205 in 2004 to<br />
12,015 in <strong>2005</strong>. However the number of new start<br />
ups stayed the same in very rural areas, leading to a<br />
slight increase in the proportion of new start ups in<br />
these areas from 21.5% in 2004 to 21.8% in <strong>2005</strong>.<br />
4.72 The net change figure for <strong>2005</strong> has been<br />
included following the suggestion made in the<br />
2004/5 monitoring report. It measures the net gain<br />
or loss in the stock of registered enterprises - equal to<br />
registrations less de-registrations.There was no gain<br />
or a small loss in only four local authority areas, all<br />
but one of which were in the large urban category. In<br />
all other local authority areas there was a net gain in<br />
enterprises. New start ups in rural areas would<br />
appear to be on a par with those in urban areas.<br />
4.73 The limitation of the data used is that very<br />
small firms or those exempt from VAT are not<br />
included in the VAT registration statistics.<br />
4.74 The Annual Business Inquiry (ABI) data shows<br />
that there was a 3 per cent growth in employment in<br />
the <strong>East</strong> <strong>Midlands</strong> from 2004 to <strong>2005</strong>. The largest<br />
percentage change over this period was in the more<br />
rural areas of the region. Some care needs to be<br />
taken when interpreting the ABI data as it has<br />
experienced classification and accuracy problems in<br />
the past, and is subject to future data revision.<br />
Policy Commentary<br />
4.75 Despite the continuing decline in the numbers<br />
employed in the Region’s primary industries, there is<br />
evidence to suggest that policies geared towards the<br />
diversification and development of the rural<br />
economy are succeeding. It is noteworthy that for the<br />
third consecutive year, more than 42% of new<br />
business start-ups occurred in district council areas<br />
defined as the most rural (i.e. R50 and R80).<br />
4.76 Overall from 2004 to <strong>2005</strong> the <strong>East</strong> <strong>Midlands</strong><br />
saw a 3% increase in the number of jobs (compared<br />
with a 2.1% increase from 2003 to 2004).The largest<br />
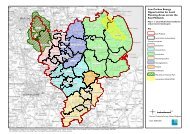
increase was in rural (R50) areas.The map shows that<br />
some rural areas have seen a decline in the number<br />
of jobs, but overall, rural areas appear to be<br />
performing as well as large urban areas.<br />
4.77 Leicestershire County Council, through<br />
the Leicestershire Rural Partnership,<br />
provides grant schemes to<br />
encourage and support<br />
diversification in rural<br />
areas.These include<br />
the New Life for<br />
Redundant<br />
Buildings Initiative,<br />
the Rural Micro<br />
Business Grant<br />
and the Rural<br />
Retail<br />
Development<br />
Scheme. The<br />
Farmers<br />
Development Grant,<br />
funded by emda<br />
through the<br />
Leicestershire Economic<br />
Partnership (LSEP), is<br />
administered by the County Council<br />
to help farm-based diversification.<br />
Policy 25: <strong>Regional</strong> Priorities for Tourism<br />
Development Plans, Local Development<br />
Frameworks, tourism strategies and SSP<br />
Partnerships should seek to identify areas of<br />
potential for tourism growth which maximises<br />
economic benefit whilst minimising adverse<br />
impact on the environment and local amenity<br />
Targets:<br />
• 15,000 new jobs in tourism by 2008<br />
• Visitor spending in region to increase by 2% by<br />
2010<br />
• Tourism to contribute 4.5% of region’s GDP by 2010<br />
Indicators:<br />
• Number of new of jobs in tourist related activities<br />
• Visitor spending in region<br />
• Number of overnight stays in region<br />
68


