Lightweight Concrete for High Strength - Expanded Shale & Clay
Lightweight Concrete for High Strength - Expanded Shale & Clay
Lightweight Concrete for High Strength - Expanded Shale & Clay

You also want an ePaper? Increase the reach of your titles
YUMPU automatically turns print PDFs into web optimized ePapers that Google loves.
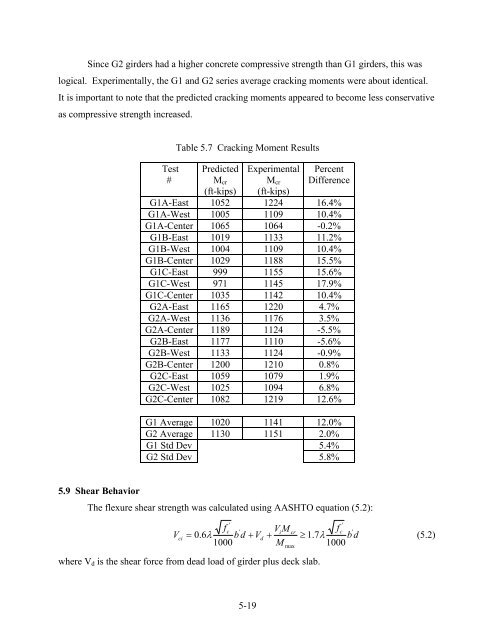
Since G2 girders had a higher concrete compressive strength than G1 girders, this was<br />
logical. Experimentally, the G1 and G2 series average cracking moments were about identical.<br />
It is important to note that the predicted cracking moments appeared to become less conservative<br />
as compressive strength increased.<br />
Test<br />
#<br />
Table 5.7 Cracking Moment Results<br />
Predicted<br />
M cr<br />
(ft-kips)<br />
Experimental<br />
M cr<br />
(ft-kips)<br />
Percent<br />
Difference<br />
G1A-East 1052 1224 16.4%<br />
G1A-West 1005 1109 10.4%<br />
G1A-Center 1065 1064 -0.2%<br />
G1B-East 1019 1133 11.2%<br />
G1B-West 1004 1109 10.4%<br />
G1B-Center 1029 1188 15.5%<br />
G1C-East 999 1155 15.6%<br />
G1C-West 971 1145 17.9%<br />
G1C-Center 1035 1142 10.4%<br />
G2A-East 1165 1220 4.7%<br />
G2A-West 1136 1176 3.5%<br />
G2A-Center 1189 1124 -5.5%<br />
G2B-East 1177 1110 -5.6%<br />
G2B-West 1133 1124 -0.9%<br />
G2B-Center 1200 1210 0.8%<br />
G2C-East 1059 1079 1.9%<br />
G2C-West 1025 1094 6.8%<br />
G2C-Center 1082 1219 12.6%<br />
G1 Average 1020 1141 12.0%<br />
G2 Average 1130 1151 2.0%<br />
G1 Std Dev 5.4%<br />
G2 Std Dev 5.8%<br />
5.9 Shear Behavior<br />
The flexure shear strength was calculated using AASHTO equation (5.2):<br />
V<br />
ci<br />
'<br />
fc<br />
'<br />
= 0.6λ<br />
b d + V<br />
1000<br />
d<br />
ViM<br />
+<br />
M<br />
where V d is the shear <strong>for</strong>ce from dead load of girder plus deck slab.<br />
cr<br />
max<br />
'<br />
fc<br />
'<br />
≥ 1.7λ<br />
b d<br />
1000<br />
(5.2)<br />
5-19