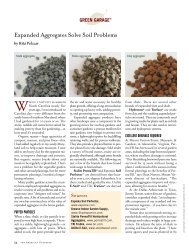
Lightweight Concrete for High Strength - Expanded Shale & Clay
Lightweight Concrete for High Strength - Expanded Shale & Clay
Lightweight Concrete for High Strength - Expanded Shale & Clay

You also want an ePaper? Increase the reach of your titles
YUMPU automatically turns print PDFs into web optimized ePapers that Google loves.
V<br />
"<br />
pc<br />
cw− Pr ed<br />
= ft<br />
−Pr<br />
ed<br />
1 +<br />
"<br />
ft<br />
−Pr<br />
ed<br />
f<br />
bd<br />
p<br />
(5.5)<br />
The predicted diagonal tensile strength, f’’ t-Pred was calculated using equation 5.6:<br />
f<br />
"<br />
t−<br />
Pr ed<br />
= 4λ<br />
f<br />
'<br />
c<br />
(5.6)<br />
5.9.1 Initial Shear Cracking<br />
Table 5.8 provides an overview of initial shear cracking. The predicted values were<br />
calculated at the midpoint of the shear span. The experimental value was the applied shear at<br />
which cracking was first recorded visually or electronically.<br />
Examination of Table 5.8 showed that the AASHTO (1996) Standard method of<br />
calculating concrete shear strength was conservative overall. In the case of girder tests G1C-<br />
Center and G2C-Center, the prediction was less than 3 percent unconservative. The AASHTO<br />
LRFD (1998) technique provided predictions of concrete strength that far underestimated their<br />
capacity. The ACI alternate approach provided the closest prediction <strong>for</strong> V c where the cracking<br />
shear was equated to the shear strength provided by the concrete. Overall, the predicted V c<br />
values were within about 6 percent of experimental values <strong>for</strong> both the G1 and G2 girder tests.<br />
Girder tests G1C-Center and G2C-Center showed the greatest difference from the ACI alternate<br />
predicted values, about 18 percent unconservative overall. Both the tests involved the minimum<br />
stirrup spacing of 24 inches.<br />
5.9.2 Ultimate Shear Capacity<br />
Table 5.9 provides an overview of predicted ultimate shear capacity calculated by the<br />
AASHTO Standard method and the AASHTO LRFD method with the strength reduction factor,<br />
φ s , of 1 and compares them to the experimental maximum shear values. Using the AASHTO<br />
Standard method, the stirrup yield strength was capped at 60 ksi as required by the code, and the<br />
results also recorded. Since the value of f y was 62 ksi, there was an insignificant difference in<br />
predicted values.<br />
5-21