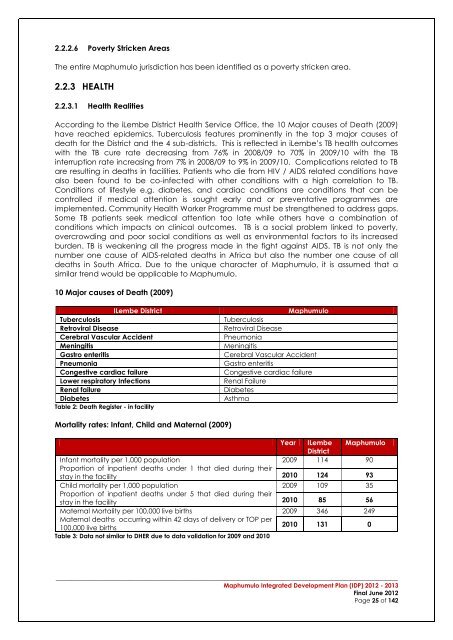
2.2.2.6 Poverty Stricken AreasThe entire <strong>Maphumulo</strong> jurisdiction has been identified as a poverty stricken area.2.2.3 HEALTH2.2.3.1 Health RealitiesAccording to the iLembe District Health Service Office, the 10 Major causes of Death (2009)have reached epidemics. Tuberculosis features prominently in the top 3 major causes ofdeath for the District and the 4 sub-districts. This is reflected in iLembe’s TB health outcomeswith the TB cure rate decreasing from 76% in 2008/09 to 70% in 2009/10 with the TBinterruption rate increasing from 7% in 2008/09 to 9% in 2009/10. Complications related to TBare resulting in deaths in facilities. Patients who die from HIV / AIDS related conditions havealso been found to be co-infected with other conditions with a high correlation to TB.Conditions of lifestyle e.g. diabetes, and cardiac conditions are conditions that can becontrolled if medical attention is sought early and or preventative programmes areimplemented. Community Health Worker Programme must be strengthened to address gaps.Some TB patients seek medical attention too late while others have a combination ofconditions which impacts on clinical outcomes. TB is a social problem linked to poverty,overcrowding and poor social conditions as well as environmental factors to its increasedburden. TB is weakening all the progress made in the fight against AIDS. TB is not only thenumber one cause of AIDS-related deaths in Africa but also the number one cause of alldeaths in South Africa. Due to the unique character of <strong>Maphumulo</strong>, it is assumed that asimilar trend would be applicable to <strong>Maphumulo</strong>.10 Major causes of Death (2009)ILembe DistrictTuberculosisRetroviral DiseaseCerebral Vascular AccidentMeningitisGastro enteritisPneumoniaCongestive cardiac failureLower respiratory InfectionsRenal failureDiabetesTable 2: Death Register - in facility<strong>Maphumulo</strong>TuberculosisRetroviral DiseasePneumoniaMeningitisCerebral Vascular AccidentGastro enteritisCongestive cardiac failureRenal FailureDiabetesAsthmaMortality rates: Infant, Child and Maternal (2009)Infant mortality per 1,000 populationProportion of inpatient deaths under 1 that died during theirstay in the facilityChild mortality per 1,000 populationProportion of inpatient deaths under 5 that died during theirstay in the facilityMaternal Mortality per 100,000 live birthsMaternal deaths occurring within 42 days of delivery or TOP per100,000 live birthsTable 3: Data not similar to DHER due to data validation for 2009 and 2010Year ILembeDistrict<strong>Maphumulo</strong>2009 114 902010 124 932009 109 352010 85 562009 346 2492010 131 0__________________________________________________________________________________________<strong>Maphumulo</strong> Integrated <strong>Development</strong> Plan (<strong>IDP</strong>) 2012 - 2013Final June 2012Page 25 of 142
The preceding information not only provides relevance and comparison to the other localmunicipalities within the family, but demonstrates the position with regards to mortality within<strong>Maphumulo</strong>.Infant Mortality (comparative within the iLembe Family of Municipalities)2009 appears highest in Ndwedwe due to the low numerator (15 under 1 year olddeaths/ 67separations). Performance appeared to have improved in 2010 due to thecalculation (122 under 1 year old deaths/ 221 separations), however there was an 87%increase in total infant deaths in this sub district. Pneumonia under 5 years andDiarrhoea under 5 years with dehydration have been increased from 2008/09 (11,107 &3,360) to 2009/10 (15,133 & 4,475) which would impact on mortality The district willembark on a project to track infants referred out of the district to uMgungundlovu to getthe real picture of performance.In 2010 KwaDukuza infant mortality increased from 2009 where it stood at 178 to 199. Theraw data reveals that in 2009, 79 infant deaths/ 442 separations and in 2010, 139/700separations which is a 43% increase in total number of infant deaths.<strong>Maphumulo</strong> Sub district appears constant with a slight increase in 2010. In 2009 therewere 39 infant deaths/ 431 separations and in 2010 45 infant deaths /484 separations,which is a 13% increase. However both district hospitals refer to Stanger. The District isplanning to track numbers linked to the sub district that appear in Stanger hospital.The district appears constant with a slight increase in 2010. In 2009 there were 145 infantdeaths/ 1,267 separation and in 2010 206 infant deaths /1,612 separations, which is a29% increase. In actual infant deaths however both district hospitals refer to Stanger. TheDistrict is planning to track and track numbers linked to the sub districts that appear inStanger hospital.Immunisation coverage and measles coverage less than 1 year have both increasedsignificantly. Immunisation coverage was 87.0% in 2010/11and increased to 86% in2009/10 and measles coverage increased from 89% in 2010/11 to 81% in 2009/10, whichis an 8% increase.Child Mortality(comparative within the iLembe Family of Municipalities) Although KwaDukuza appears to have improved outputs, when tracking raw data a32% increase in child deaths was recorded {2009 – 106 child deaths /616 separationsand in 2010, 157 child deaths / 1,204 separations}. <strong>Maphumulo</strong>, in 2009, 17 infant deaths /476 separations 67 under 5 deaths / 1,199separations, which reveals a 74% increase in actual child deaths.Ndwedwe Sub district had 8 child deaths / 66 separations in 2009 and in 2010, had11child deaths / 153 which is a 27% increase. Maternal Mortality In 2010 KwaDukuza was 166/100,000 live births and in 2009,433/100,000, Actual figures revealed that in 2010 there were 11 maternal deaths /6,632live births and in 2009 26 maternal deaths / 5,991 live births which is a 56% decrease inactual number of maternal death.In 2010 <strong>Maphumulo</strong> MMR was 0/100,000 live births and in 2009, 249/100,000. Actualfigures revealed that in 2010 there were 0 maternal deaths /2,639 live births and in 2009 4maternal deaths / 1,602 live births which is a 400% increase in actual number of maternaldeaths. In 2010 Ndwedwe was 0/100,000 live births and in 2009, 0/100,000. Actual figuresrevealed that in 2010 there were 0 maternal deaths /1,832 live births and in 2009, 4maternal deaths / 1,075 live births which are a 400% increase in actual number ofmaternal deaths.Avoidable deaths linked to clinical care can be addressed through improvement ofclinical skills through workshops training and teachable moments.Strengthening referral system.__________________________________________________________________________________________<strong>Maphumulo</strong> Integrated <strong>Development</strong> Plan (<strong>IDP</strong>) 2012 - 2013Final June 2012Page 26 of 142
- Page 1: Maphumulo Local MunicipalityMaphumu
- Page 5 and 6: 4.2.2.2 The New Growth Path Focus .
- Page 7 and 8: 6.6.4 THE PLAN ....................
- Page 9 and 10: Figure 9: Infrastructure, Community
- Page 11 and 12: FOREWORD BY HER WORSHIP, THE MAYOR
- Page 13 and 14: 1. Municipal Transformation and Ins
- Page 15 and 16: the local economy and the search fo
- Page 17 and 18: 1.7 MUNICIPAL TURN AROUND STRATEGY
- Page 19 and 20: infrastructure limits social inclus
- Page 21: 2.2 PROFILE OF THE MAPHUMULO MUNICI
- Page 24 and 25: 2.2.2.3 Sectoral ContributionPublic
- Page 28 and 29: Mandeni does not have a hospital th
- Page 30 and 31: CrimeCategoryApril2003-March2004Apr
- Page 32 and 33: 2.2.7 DISASTER MANAGEMENTILembe Dis
- Page 34 and 35: MAP 5: Maphumulo GeologyGneiss foun
- Page 36 and 37: agriculture. The Tugela River valle
- Page 38 and 39: MAP 13: Maphumulo Land SensitivityT
- Page 40 and 41: The Slope of Maphumulo indicates th
- Page 42 and 43: 17. The Department of Environmental
- Page 44 and 45: Eco-School ProgrammeWithin IDM, DAE
- Page 46 and 47: 11 1,812 1,812 59 1,753 59 97%Total
- Page 48 and 49: Funding for stage2 approved.KwaHlon
- Page 50 and 51: 2.6.3 ORGANISATIONAL STRUCTUREThe r
- Page 52 and 53: Figure 10: Budget and Treasury Depa
- Page 54 and 55: 2.6.6 COMMUNITY DEVELOPMENT WORKER
- Page 56 and 57: strategic session include; the purp
- Page 58 and 59: HousingEconomicDevelopmentandWater
- Page 60 and 61: OPPORTUNITIESOpportunity to effecti
- Page 62 and 63: Energy Usage- environmental changeA
- Page 64 and 65: 3.1.4 MAPHUMULO VISIONThe municipal
- Page 66 and 67: 4 CHAPTER 4 - THE SPATIAL DEVELOPME
- Page 68 and 69: 4.2.2 THE NEW GROWTH PATH4.2.2.1 In
- Page 70 and 71: 4.2.3 PROVINCIAL SPATIAL ECONOMIC D
- Page 72 and 73: 4.2.4 THE PROVINCIAL GROWTH AND DEV
- Page 74 and 75: Capitalise on complementarities and
- Page 76 and 77:
The various nodes and their broad i
- Page 78 and 79:
MAP 18: Provincial Spatial Developm
- Page 80 and 81:
MaphumuloMunicipalityMAP 20: KZN Sp
- Page 82 and 83:
inputs and thus the investment requ
- Page 84 and 85:
Settlement in Maphumulo Municipalit
- Page 86 and 87:
Introduction and application of the
- Page 88 and 89:
4.11.1 PRIMARY CORRIDORSThe primary
- Page 90 and 91:
They are to be used to manage, dire
- Page 92 and 93:
Protection and enhancement of the n
- Page 94 and 95:
7.3 DEPARTMENT OF EDUCATIONThe visi
- Page 96 and 97:
7.5 DEPARTMENT OF COPERATIVR GOVERN
- Page 98 and 99:
7.8 THE DEPARTMENT SOCIAL DEVELOPME
- Page 100 and 101:
7.11 DEPARTMENT SPORT &RECREATION7.
- Page 102 and 103:
MaphumuloOtimati old clinicconversi
- Page 104 and 105:
Joel Jp 3 Constructi 10,277,520onKw
- Page 106 and 107:
Cemeteries:StudyDevelopmentPlannedS
- Page 108 and 109:
development, infrastructure and inc
- Page 110 and 111:
6.2.5 THE PLANThe plan aims to ensu
- Page 112 and 113:
Refer to KPA Schedule and Performan
- Page 114 and 115:
• Task 1: Development of a transp
- Page 116 and 117:
* The figures are subject to change
- Page 118 and 119:
6.6 FINANCIAL VIABILITY AND MANAGEM
- Page 120 and 121:
7 CHAPTER 7 - FINANCIAL MANAGEMENT7
- Page 122 and 123:
Below is a summary of expenditure a
- Page 124 and 125:
Figure 20: Maphumulo Capital Budget
- Page 126 and 127:
Ensuring that growth in services is
- Page 128 and 129:
8.4 MAPHUMULO PERFORMANCE MANAGEMEN
- Page 130 and 131:
Figure 23: IDP / Budget / PMS LinkI
- Page 132 and 133:
9 CHAPTER 9 - IMPLEMENTATION PLAN9.
- Page 134 and 135:
Continued and effective participati
- Page 136 and 137:
The results of policy decisions bec
- Page 138 and 139:
Annexure A:Spatial Development Fram
- Page 140 and 141:
12 APPENDICES______________________
- Page 143 and 144:
Maphumulo Local MunicipalityCapital
- Page 145 and 146:
Maphumulo Local MunicipalityCapital
- Page 147 and 148:
Maphumulo Local MunicipalityCapital
- Page 149:
Appendix 2:Service Delivery Budget