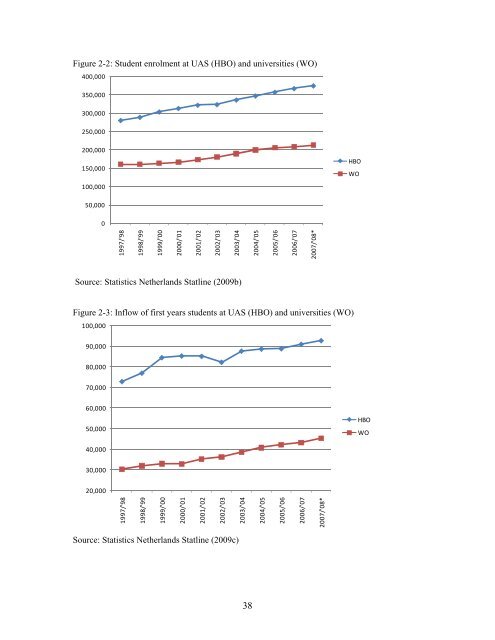
Figure 2-2: Student enrolment at UAS (HBO) and universities (WO)400,000350,000300,000250,000200,000150,000100,000HBOWO50,00001997/'981998/'991999/'002000/'012001/'022002/'032003/'042004/'052005/'062006/'072007/'08*Source: Statistics <strong>Netherlands</strong> Statline (2009b)Figure 2-3: Inflow of first years students at UAS (HBO) and universities (WO)100,00090,00080,00070,00060,00050,000HBOWO40,00030,00020,0001997/'981998/'991999/'002000/'012001/'022002/'032003/'042004/'052005/'062006/'072007/'08*Source: Statistics <strong>Netherlands</strong> Statline (2009c)38
Table 2-1: Student enrolment at UAS in the <strong>Amsterdam</strong> metropolitan areaHs. van<strong>Amsterdam</strong>Hs.INHolland*<strong>Amsterdam</strong>se Hs. voorHs. IPABO GerritRietveldTotal<strong>Netherlands</strong>de KunstenAcademie1998 23,986 2,162 947 889 288,7791999 25,346 2,106 1,091 870 303,3882000 25,729 2,179 1,210 862 312,9052001 26,598 2,341 1,233 797 321,7412002 25,164 13,624 2,480 1,301 795 323,1442003 26,740 16,000 2,547 1,478 846 335,8602004 28,557 15,822 2,626 1,673 913 346,8352005 31,223 15,582 2,728 1,794 961 357,0232006 33,575 14,964 2,884 1,774 981 366,8562007 36,193 14,671 2,902 1,681 998 374,9352008 38,139 14,641 2,940 1,451 997 383,833* Numbers are only for the departments of INHolland in the <strong>Amsterdam</strong> metropolitan regionSource: HBO-raad (2009b), Individual HEIsTable 2-2: Student enrolment at universities in the <strong>Amsterdam</strong> metropolitan areaUniversity of VU University Total <strong>Netherlands</strong><strong>Amsterdam</strong> <strong>Amsterdam</strong>2002 21,469 15,694 178,5532003 22,137 16,413 188,0842004 23,869 17,100 198,0882005 24,906 17,982 204,4362006 25,694 18,651 207,1592007 27,062 19,274 211,4742008 28,331 20,984 219,018Source: VSNU (2009a)Table 2-3 shows the split in educational programmes offered by UAS and research universitiesaccording to the source of funding in 2004. As the table indicates, 35% of all educationalprogrammes (657 out of 1842) are offered by privately funded UAS. Most of these educationalprogrammes are in the domain of economics (Jongbloed et al., 2004: 10-11). In total there were62 privately-funded UAS in 2004. Among research universities the share of educationalprogrammes provided by privately-funded institutions was negligible: only 33 out of an estimatedtotal of around 1,000 programmes were offered by privately-funded institutes. Most of theseeducational programmes were in the theology domain. It is estimated that the number of studentsat privately-funded UAS and research universities is around 60,000 to 70,000 (ibid: 14).Table 2-3: Public and private funding in higher educationNumber of educational programmesPublic funding Private fundingHBO 1185 657University 967 33Source: Jongbloed et al. (2004)Figure 2-4 is based on a broad classification of educational programmes at UAS into sevendifferent types: hoger agrarisch onderwijs (higher agricultural education, HAO), hogereconomisch onderwijs (higher economic education, HEO), hoger gezondheidszorg onderwijs39
- Page 1 and 2: Please cite this paper as:SEO Econo
- Page 6 and 7: 2.3 Higher education and the labor
- Page 8 and 9: 6.3 Mechanisms to promote regional
- Page 10 and 11: Table 4-4: Completion rates of diff
- Page 12 and 13: LSCA Life Sciences Center Amsterdam
- Page 14 and 15: such as regional authorities and th
- Page 17 and 18: 1. OVERVIEW OF THE REGION1.1 Introd
- Page 19 and 20: the southEastern part of Amsterdam
- Page 21 and 22: elatively bad accessibility of the
- Page 23 and 24: metropolitan area exceeded that of
- Page 25: egion suffer from one of the follow
- Page 28 and 29: Figure 1-7: Dropouts secondary educ
- Page 30 and 31: Figure 1-9: Employment in Amsterdam
- Page 32 and 33: high-tech sectors is relatively hig
- Page 34 and 35: 1.4.4 Labor market indicatorsTable
- Page 36 and 37: The central government is responsib
- Page 38 and 39: implemented. There is also an admin
- Page 41 and 42: 2 CHARACTERISTICS OF THE HIGHER EDU
- Page 43 and 44: Source: MinOCW (2007a: 68), EU (199
- Page 45: (ibid: 83). In part, this new syste
- Page 49 and 50: Figure 2-5: Students at universitie
- Page 51 and 52: Figure 2-6: Participation in tertia
- Page 53 and 54: also show a continued high demand f
- Page 55 and 56: not receive funding from the govern
- Page 57 and 58: of diplomas awarded and the number
- Page 59: decision is up to the HEI itself. I
- Page 62 and 63: Figure 3-1: Components of an innova
- Page 64 and 65: 3.2.3 National funding frameworkThe
- Page 66 and 67: challenge for the years to come wil
- Page 68 and 69: Figure 3-3: R&D expenditures in Noo
- Page 70 and 71: Amsterdam Topstad programme.Creativ
- Page 72 and 73: 3.5.3 Life SciencesGiven the high l
- Page 74 and 75: Figure 3-4: Employment in Amsterdam
- Page 76 and 77: years. Employment in the trade and
- Page 78 and 79: employment has no upward or downwar
- Page 80 and 81: and more efficient exploitation of
- Page 82 and 83: mostly happens in the context of R&
- Page 84 and 85: income related to IP rights. The fa
- Page 86 and 87: Figure 3-6: Regional innovation sys
- Page 88 and 89: HEIs to play this role, as it draws
- Page 91 and 92: 4 CONTRIBUTION OF TEACHING & LEARNI
- Page 93 and 94: housing market, on the ‘buying ma
- Page 95 and 96: transport, finance, financial manag
- Page 97 and 98:
HvA participates in several initiat
- Page 99 and 100:
4.4 Student recruitment and regiona
- Page 101 and 102:
4.4.1.2 Recruitment of foreign stud
- Page 103 and 104:
• HvA has made its educational pr
- Page 105 and 106:
The HEIs have several external and
- Page 107 and 108:
Table 4-4: Completion rates of diff
- Page 109 and 110:
4.7 Enhancing the regional learning
- Page 111 and 112:
4.8 ConclusionTable 4-6: SWOTStreng
- Page 113:
Amsterdam is matched by a relative
- Page 116 and 117:
The challenge for future social pol
- Page 118 and 119:
The VU likewise develops research p
- Page 120 and 121:
directing, documentary directing, s
- Page 122 and 123:
the university to improve its energ
- Page 125 and 126:
6.1 Introduction6 CAPACITY BUILDING
- Page 127 and 128:
Figure 6-1: Organization chart Vrij
- Page 129 and 130:
There are also examples of more spe
- Page 131 and 132:
Box 6-2: Obstacles for collaboratio
- Page 133 and 134:
eyond labor market studies, there a
- Page 135 and 136:
7 CONCLUSIONS: MOVING BEYOND THE SE
- Page 137 and 138:
…requires different forms of coop
- Page 139 and 140:
at higher levels in order to mainta
- Page 141 and 142:
to increase the interaction between
- Page 143 and 144:
mobility in the world is slackening
- Page 145 and 146:
ecause they are better informed abo
- Page 147 and 148:
REFERENCESAalders, R., A. Bakkeren,
- Page 149 and 150:
EZ Amsterdam (2006), “Research Bu
- Page 151 and 152:
MinOCW (2007a), “The Education Sy
- Page 153 and 154:
SER (2008), “Duurzame Globaliseri
- Page 155:
Versleijen, A., van der Meulen, B.,
- Page 158 and 159:
Institution City Type ofHEIANNEX B:
- Page 160 and 161:
Groningenculture)Hogeschool Amsterd
- Page 163 and 164:
ANNEX C: KEY ECONOMIC INDICATORSTab
- Page 165 and 166:
ANNEX E: REGIONAL PARTNERSHIPS OF A
- Page 167 and 168:
AmsterdamUniversity CollegeOther re
- Page 169 and 170:
ANNEX F: BUSINESSES REPRESENTED IN
- Page 171 and 172:
GLOSSARYBologna DeclarationForeign