- Page 2 and 3: CULTURE, POWER AND PRACTICES:THE GL
- Page 7 and 8: viABOUT THE BOOKCULTURE, POWER AND
- Page 9 and 10: viiiACKNOWLEDGEMENTSThe API Coordin
- Page 11 and 12: x(co-authored with Gunawan Wiradi,
- Page 13 and 14: xiiSri Wahyuni is the director of t
- Page 15 and 16: xivThe gap between rich and poor is
- Page 17 and 18: xviand development mainly: Economy,
- Page 19 and 20: xviiiIn closing, I would like to qu
- Page 21 and 22: xxmovements to defend their rights,
- Page 23 and 24: xxiicomplex relationships between f
- Page 25 and 26: xxivIndonesian Academy of Social Sc
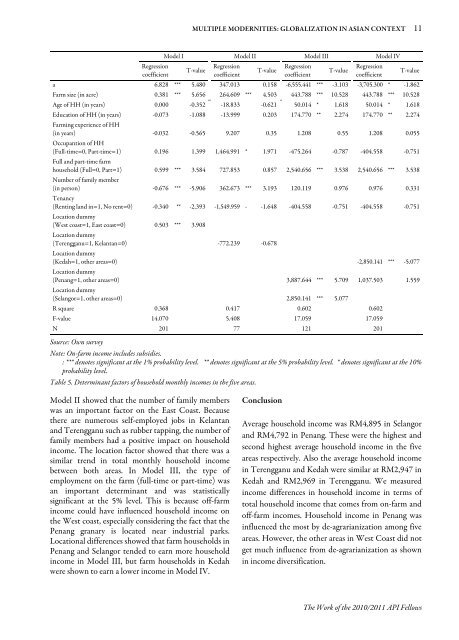
- Page 28 and 29: MULTIPLE MODERNITIES: GLOBALIZATION
- Page 30 and 31: MULTIPLE MODERNITIES: GLOBALIZATION
- Page 32 and 33: MULTIPLE MODERNITIES: GLOBALIZATION
- Page 34 and 35: MULTIPLE MODERNITIES: GLOBALIZATION
- Page 36 and 37: MULTIPLE MODERNITIES: GLOBALIZATION
- Page 40 and 41: MULTIPLE MODERNITIES: GLOBALIZATION
- Page 42 and 43: MULTIPLE MODERNITIES: GLOBALIZATION
- Page 44 and 45: MULTIPLE MODERNITIES: GLOBALIZATION
- Page 46 and 47: MULTIPLE MODERNITIES: GLOBALIZATION
- Page 48 and 49: MULTIPLE MODERNITIES: GLOBALIZATION
- Page 50 and 51: MULTIPLE MODERNITIES: GLOBALIZATION
- Page 52 and 53: MULTIPLE MODERNITIES: GLOBALIZATION
- Page 54 and 55: MULTIPLE MODERNITIES: GLOBALIZATION
- Page 56 and 57: MULTIPLE MODERNITIES: GLOBALIZATION
- Page 58 and 59: POTENTIAL OF LOCAL KNOWLEDGE AND PR
- Page 60 and 61: POTENTIAL OF LOCAL KNOWLEDGE AND PR
- Page 62 and 63: POTENTIAL OF LOCAL KNOWLEDGE AND PR
- Page 64 and 65: POTENTIAL OF LOCAL KNOWLEDGE AND PR
- Page 66 and 67: POTENTIAL OF LOCAL KNOWLEDGE AND PR
- Page 68 and 69: POTENTIAL OF LOCAL KNOWLEDGE AND PR
- Page 70 and 71: POTENTIAL OF LOCAL KNOWLEDGE AND PR
- Page 72 and 73: POTENTIAL OF LOCAL KNOWLEDGE AND PR
- Page 74 and 75: POTENTIAL OF LOCAL KNOWLEDGE AND PR
- Page 76 and 77: POTENTIAL OF LOCAL KNOWLEDGE AND PR
- Page 78 and 79: POTENTIAL OF LOCAL KNOWLEDGE AND PR
- Page 80 and 81: POTENTIAL OF LOCAL KNOWLEDGE AND PR
- Page 82: POTENTIAL OF LOCAL KNOWLEDGE AND PR
- Page 85 and 86: 58 Panel 2(Left) Kurazukuri are anc
- Page 88 and 89:
POTENTIAL OF LOCAL KNOWLEDGE AND PR
- Page 90 and 91:
POTENTIAL OF LOCAL KNOWLEDGE AND PR
- Page 92 and 93:
POTENTIAL OF LOCAL KNOWLEDGE AND PR
- Page 94 and 95:
POTENTIAL OF LOCAL KNOWLEDGE AND PR
- Page 96 and 97:
POTENTIAL OF LOCAL KNOWLEDGE AND PR
- Page 98 and 99:
POTENTIAL OF LOCAL KNOWLEDGE AND PR
- Page 100 and 101:
POTENTIAL OF LOCAL KNOWLEDGE AND PR
- Page 102 and 103:
POTENTIAL OF LOCAL KNOWLEDGE AND PR
- Page 104 and 105:
POTENTIAL OF LOCAL KNOWLEDGE AND PR
- Page 106 and 107:
POTENTIAL OF LOCAL KNOWLEDGE AND PR
- Page 108 and 109:
POTENTIAL OF LOCAL KNOWLEDGE AND PR
- Page 110 and 111:
POTENTIAL OF LOCAL KNOWLEDGE AND PR
- Page 112 and 113:
POTENTIAL OF LOCAL KNOWLEDGE AND PR
- Page 114 and 115:
POTENTIAL OF LOCAL KNOWLEDGE AND PR
- Page 116 and 117:
POTENTIAL OF LOCAL KNOWLEDGE AND PR
- Page 118 and 119:
POTENTIAL OF LOCAL KNOWLEDGE AND PR
- Page 120 and 121:
POTENTIAL OF LOCAL KNOWLEDGE AND PR
- Page 122 and 123:
POTENTIAL OF LOCAL KNOWLEDGE AND PR
- Page 124 and 125:
POTENTIAL OF LOCAL KNOWLEDGE AND PR
- Page 126 and 127:
POTENTIAL OF LOCAL KNOWLEDGE AND PR
- Page 128 and 129:
MULTIPLE IDENTITIES VIA THE GLOBALI
- Page 130 and 131:
MULTIPLE IDENTITIES VIA THE GLOBALI
- Page 132 and 133:
MULTIPLE IDENTITIES VIA THE GLOBALI
- Page 134 and 135:
MULTIPLE IDENTITIES VIA THE GLOBALI
- Page 136 and 137:
MULTIPLE IDENTITIES VIA THE GLOBALI
- Page 138 and 139:
MULTIPLE IDENTITIES VIA THE GLOBALI
- Page 140 and 141:
MULTIPLE IDENTITIES VIA THE GLOBALI
- Page 142 and 143:
MULTIPLE IDENTITIES VIA THE GLOBALI
- Page 144 and 145:
MULTIPLE IDENTITIES VIA THE GLOBALI
- Page 146 and 147:
MULTIPLE IDENTITIES VIA THE GLOBALI
- Page 148 and 149:
MULTIPLE IDENTITIES VIA THE GLOBALI
- Page 150 and 151:
MULTIPLE IDENTITIES VIA THE GLOBALI
- Page 152 and 153:
MULTIPLE IDENTITIES VIA THE GLOBALI
- Page 154 and 155:
MULTIPLE IDENTITIES VIA THE GLOBALI
- Page 156 and 157:
MULTIPLE IDENTITIES VIA THE GLOBALI
- Page 158 and 159:
MULTIPLE IDENTITIES VIA THE GLOBALI
- Page 160 and 161:
MULTIPLE IDENTITIES VIA THE GLOBALI
- Page 162 and 163:
MULTIPLE IDENTITIES VIA THE GLOBALI
- Page 164 and 165:
MULTIPLE IDENTITIES VIA THE GLOBALI
- Page 166 and 167:
MULTIPLE IDENTITIES VIA SPIRITUALIT
- Page 168 and 169:
MULTIPLE IDENTITIES VIA SPIRITUALIT
- Page 170 and 171:
MULTIPLE IDENTITIES VIA SPIRITUALIT
- Page 172 and 173:
MULTIPLE IDENTITIES VIA SPIRITUALIT
- Page 174 and 175:
MULTIPLE IDENTITIES VIA SPIRITUALIT
- Page 176 and 177:
MULTIPLE IDENTITIES VIA SPIRITUALIT
- Page 178 and 179:
MULTIPLE IDENTITIES VIA SPIRITUALIT
- Page 180 and 181:
MULTIPLE IDENTITIES VIA SPIRITUALIT
- Page 182 and 183:
MULTIPLE IDENTITIES VIA SPIRITUALIT
- Page 184 and 185:
MULTIPLE IDENTITIES VIA SPIRITUALIT
- Page 186 and 187:
MULTIPLE IDENTITIES VIA SPIRITUALIT
- Page 188 and 189:
MULTIPLE IDENTITIES VIA SPIRITUALIT
- Page 190 and 191:
MULTIPLE IDENTITIES VIA SPIRITUALIT
- Page 192 and 193:
MULTIPLE IDENTITIES VIA SPIRITUALIT
- Page 194 and 195:
MULTIPLE IDENTITIES VIA SPIRITUALIT
- Page 196 and 197:
MULTIPLE IDENTITIES VIA SPIRITUALIT
- Page 198 and 199:
MULTIPLE IDENTITIES VIA SPIRITUALIT
- Page 200 and 201:
MULTIPLE IDENTITIES VIA SPIRITUALIT
- Page 202 and 203:
MULTIPLE IDENTITIES VIA SPIRITUALIT
- Page 204 and 205:
MULTIPLE IDENTITIES VIA SPIRITUALIT
- Page 206 and 207:
MULTIPLE IDENTITIES VIA SPIRITUALIT
- Page 208 and 209:
MULTIPLE IDENTITIES VIA SPIRITUALIT
- Page 210 and 211:
MULTIPLE IDENTITIES VIA SPIRITUALIT
- Page 212 and 213:
MULTIPLE IDENTITIES VIA SPIRITUALIT
- Page 214 and 215:
MULTIPLE IDENTITIES VIA SPIRITUALIT
- Page 216 and 217:
MULTIPLE IDENTITIES VIA SPIRITUALIT
- Page 218 and 219:
MULTIPLE IDENTITIES VIA SPIRITUALIT
- Page 220 and 221:
FLUX AND FLOWS OF PEOPLE, POWER AND
- Page 222 and 223:
FLUX AND FLOWS OF PEOPLE, POWER AND
- Page 224 and 225:
FLUX AND FLOWS OF PEOPLE, POWER AND
- Page 226 and 227:
FLUX AND FLOWS OF PEOPLE, POWER AND
- Page 228 and 229:
FLUX AND FLOWS OF PEOPLE, POWER AND
- Page 230 and 231:
FLUX AND FLOWS OF PEOPLE, POWER AND
- Page 232 and 233:
FLUX AND FLOWS OF PEOPLE, POWER AND
- Page 234 and 235:
FLUX AND FLOWS OF PEOPLE, POWER AND
- Page 236 and 237:
FLUX AND FLOWS OF PEOPLE, POWER AND
- Page 238 and 239:
FLUX AND FLOWS OF PEOPLE, POWER AND
- Page 240 and 241:
FLUX AND FLOWS OF PEOPLE, POWER AND
- Page 242 and 243:
FLUX AND FLOWS OF PEOPLE, POWER AND
- Page 244 and 245:
FLUX AND FLOWS OF PEOPLE, POWER AND
- Page 246 and 247:
FLUX AND FLOWS OF PEOPLE, POWER AND
- Page 248 and 249:
FLUX AND FLOWS OF PEOPLE, POWER AND
- Page 250 and 251:
FLUX AND FLOWS OF PEOPLE, POWER AND
- Page 252 and 253:
FLUX AND FLOWS OF PEOPLE, POWER AND
- Page 254 and 255:
FLUX AND FLOWS OF PEOPLE, POWER AND
- Page 256 and 257:
FLUX AND FLOWS OF PEOPLE, POWER AND
- Page 258 and 259:
FLUX AND FLOWS OF PEOPLE, POWER AND
- Page 260 and 261:
FLUX AND FLOWS OF PEOPLE, POWER AND
- Page 262 and 263:
FLUX AND FLOWS OF PEOPLE, POWER AND
- Page 264 and 265:
FLUX AND FLOWS OF PEOPLE, POWER AND
- Page 266 and 267:
FLUX AND FLOWS OF PEOPLE, POWER AND
- Page 268 and 269:
FLUX AND FLOWS OF PEOPLE, POWER AND
- Page 270 and 271:
FLUX AND FLOWS OF PEOPLE, POWER AND
- Page 272 and 273:
OPENING REMARKS AND OVERVIEWDr. Rat
- Page 274 and 275:
247There is also a massive movement
- Page 276 and 277:
249need to be looked at, as globali
- Page 278 and 279:
251Appendix IWorkshop ScheduleThe T
- Page 280 and 281:
25313:00 - 15:00 Concluding PanelCh
- Page 282 and 283:
255THAILANDAroon Puritat, Artist an
- Page 284 and 285:
257RAPPORTEURSGarry MorrisonMarian
- Page 286 and 287:
Communication, Education and Public
- Page 288 and 289:
261have used tourism as a mechanism
- Page 290 and 291:
263Panel 4: Multiple Modernities vi
- Page 292 and 293:
265out how Asian women politicians
- Page 294 and 295:
267CONTACT DETAILS (as of March 201