Download Document - Office for Learning and Teaching
Download Document - Office for Learning and Teaching
Download Document - Office for Learning and Teaching

You also want an ePaper? Increase the reach of your titles
YUMPU automatically turns print PDFs into web optimized ePapers that Google loves.
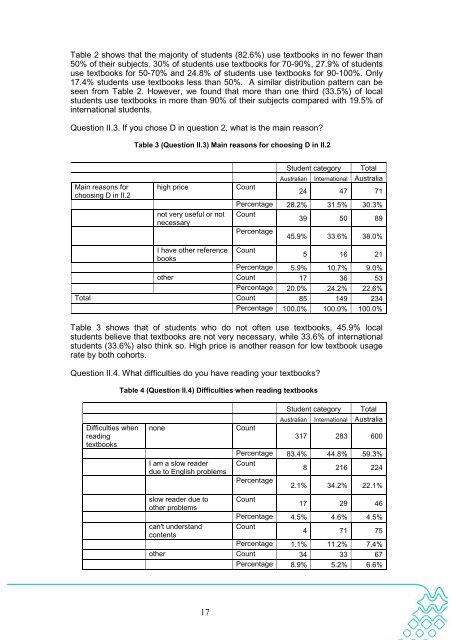
Table 2 shows that the majority of students (82.6%) use textbooks in no fewer than50% of their subjects. 30% of students use textbooks <strong>for</strong> 70-90%, 27.9% of studentsuse textbooks <strong>for</strong> 50-70% <strong>and</strong> 24.8% of students use textbooks <strong>for</strong> 90-100%. Only17.4% students use textbooks less than 50%. A similar distribution pattern can beseen from Table 2. However, we found that more than one third (33.5%) of localstudents use textbooks in more than 90% of their subjects compared with 19.5% ofinternational students.Question II.3. If you chose D in question 2, what is the main reason?Table 3 (Question II.3) Main reasons <strong>for</strong> choosing D in II.2Main reasons <strong>for</strong>choosing D in II.2high pricenot very useful or notnecessaryCountStudent category TotalAustralian International Australia24 47 71Percentage 28.2% 31.5% 30.3%Count39 50 89Percentage45.9% 33.6% 38.0%I have other reference Countbooks5 16 21Percentage 5.9% 10.7% 9.0%other Count 17 36 53Percentage 20.0% 24.2% 22.6%Total Count 85 149 234Percentage 100.0% 100.0% 100.0%Table 3 shows that of students who do not often use textbooks, 45.9% localstudents believe that textbooks are not very necessary, while 33.6% of internationalstudents (33.6%) also think so. High price is another reason <strong>for</strong> low textbook usagerate by both cohorts.Question II.4. What difficulties do you have reading your textbooks?Table 4 (Question II.4) Difficulties when reading textbooksDifficulties whenreadingtextbooksnoneI am a slow readerdue to English problemsslow reader due toother problemscan't underst<strong>and</strong>contentsCountStudent category TotalAustralian International Australia317 283 600Percentage 83.4% 44.8% 59.3%Count8 216 224PercentageCount2.1% 34.2% 22.1%17 29 46Percentage 4.5% 4.6% 4.5%Count4 71 75Percentage 1.1% 11.2% 7.4%other Count 34 33 67Percentage 8.9% 5.2% 6.6%17