- Page 1:
Wambo Coal Pty LimitedAnnual Enviro
- Page 4 and 5:
2010-2011 AEMR2.8 Water Management.
- Page 6 and 7:
2010-2011 AEMR3.13.1.3 Aboriginal C
- Page 8 and 9:
2010-2011 AEMRList of FiguresFigure
- Page 10 and 11:
List of Appendices2010-2011 AEMRApp
- Page 12 and 13:
2010-2011 AEMR1.0 Introduction1.1 S
- Page 14 and 15:
2010-2011 AEMRTable 1.0 - Annual Re
- Page 16 and 17:
JERRYS PLAINS 15kmCOAL & ALLIEDRIVE
- Page 18 and 19:
2010-2011 AEMRTable 1.2 - WCPL Mini
- Page 20 and 21:
2010-2011 AEMR1.3.3 Environmental P
- Page 22 and 23:
5UNITED COLLIERYGOLDENGW16GW17WOMBA
- Page 24 and 25:
2010-2011 AEMR1.3.7 Subsidence Mana
- Page 26 and 27:
2010-2011 AEMR1.5 Review of 2009-20
- Page 28 and 29:
2010-2011 AEMRNo DoPI Issue DoPI Ac
- Page 30 and 31:
2010-2011 AEMROpen CutDuring the re
- Page 32 and 33:
2010-2011 AEMRTable 2.1 - Productio
- Page 34 and 35:
2010-2011 AEMRthe excavators and re
- Page 36 and 37:
2010-2011 AEMRFigure 2.3 - Coal Han
- Page 38 and 39:
2010-2011 AEMRhydrocarbon spill res
- Page 40 and 41:
2010-2011 AEMRTable 2.3 - Stored Wa
- Page 42 and 43:
2010-2011 AEMRTable 2.4 - WCPL Wast
- Page 44 and 45:
2010-2011 AEMRAs discussed in the l
- Page 46 and 47:
2010-2011 AEMR3.0 EnvironmentalMana
- Page 48 and 49:
2010-2011 AEMRWambo Coal Weather St
- Page 50 and 51:
2010-2011 AEMRFigure 3.5 - 2010-201
- Page 52 and 53:
2010-2011 AEMRIn accordance with Co
- Page 54 and 55:
2010-2011 AEMRTotal Suspended Parti
- Page 56 and 57:
2010-2011 AEMR3.2.2.3 Dust Depositi
- Page 58 and 59:
2010-2011 AEMR3.3 Erosion & Sedimen
- Page 60 and 61:
2010-2011 AEMRTrigger levels for EC
- Page 62 and 63:
2010-2011 AEMRWollombi Brook record
- Page 64 and 65:
2010-2011 AEMRNovember and December
- Page 66 and 67:
GW20GW16 GW17 GW19P1P11P3NORTH WAMB
- Page 68 and 69:
2010-2011 AEMRUnited Collieries Pie
- Page 70 and 71:
2010-2011 AEMR3.7.2.2 Acacia Specie
- Page 72 and 73:
V10-A2NORTH WAMBOCREEK DIVERSIONV10
- Page 74 and 75:
2010-2011 AEMR3.8 Weeds3.8.1 Enviro
- Page 76 and 77:
2010-2011 AEMR1252010 - 2011 AEMR B
- Page 78 and 79:
2010-2011 AEMRDayL Aeq(15 minute)Ta
- Page 80 and 81:
2010-2011 AEMRAttended Noise Monito
- Page 82 and 83:
WARNINGNo part of this plan should
- Page 84 and 85:
2010-2011 AEMRGain advice on most s
- Page 86 and 87:
2010-2011 AEMRWith the commencement
- Page 88 and 89: 2010-2011 AEMRfive complaints recor
- Page 90 and 91: 2010-2011 AEMRNo. of complaints1098
- Page 92 and 93: 2010-2011 AEMRSingleton Public Scho
- Page 94 and 95: 2010-2011 AEMRTable 5.2 - Maintenan
- Page 96 and 97: 2010-2011 AEMRNETD Rehabilitation w
- Page 98 and 99: 2010-2011 AEMRtransects had a simil
- Page 100 and 101: Appendix 1Rail Haulage Records
- Page 102 and 103: Wambo Coal Pty Ltd2010-2011 AEMRTon
- Page 104 and 105: Wambo Coal Pty Ltd2010-2011 AEMRTon
- Page 106 and 107: Wambo Coal Pty Ltd2010-2011 AEMRTon
- Page 108 and 109: Wambo Coal Pty Ltd2010-2011 AEMRTon
- Page 110 and 111: Wambo Coal Pty Ltd2010-2011 AEMRTon
- Page 112 and 113: Wambo Coal Pty Ltd2010-2011 AEMRTon
- Page 114 and 115: Wambo Coal Pty Ltd2010-2011 AEMRTon
- Page 116 and 117: Wambo Coal Pty Ltd2010-2011 AEMRTon
- Page 118 and 119: Wambo Coal Pty Ltd2010-2011 AEMRTon
- Page 120 and 121: Appendix 2Environmental MonitoringP
- Page 122 and 123: Annual Environmental Management Rep
- Page 124 and 125: Wambo Coal Pty Ltd2010 - 2011 AEMRL
- Page 126 and 127: Annual Environmental Management Rep
- Page 128 and 129: Annual Environmental Management Rep
- Page 130 and 131: 876543210Annual Environmental Manag
- Page 132 and 133: Annual Environmental Management Rep
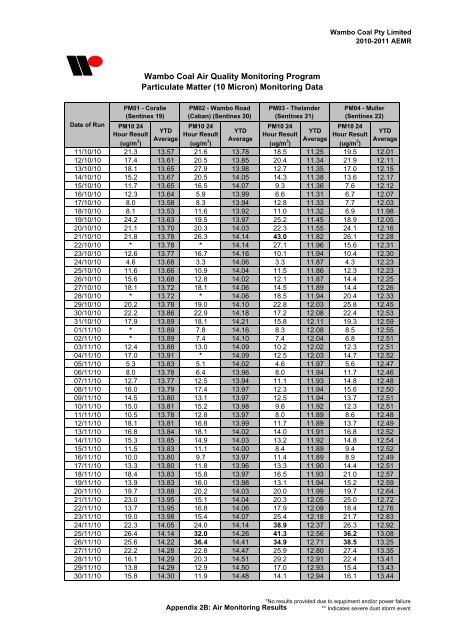
- Page 134 and 135: Wambo Coal Pty Ltd2010-2011 AEMRDat
- Page 136 and 137: Wambo Coal Pty Limited2010-2011 AEM
- Page 140 and 141: Wambo Coal Pty Limited2010-2011 AEM
- Page 142 and 143: Wambo Coal Pty Limited2010-2011 AEM
- Page 144 and 145: Annual Environmental Management Rep
- Page 146 and 147: Annual Environmental Management Rep
- Page 148 and 149: Annual Environmental Management Rep
- Page 150 and 151: Annual Environmental Management Rep
- Page 152 and 153: Wambo Coal Pty Limited2010-2011 AEM
- Page 154 and 155: FM8 - Cross Section - 21 June 20113
- Page 156 and 157: FM6 - Cross Section 21 June 201143.
- Page 158 and 159: FM4 - Cross Section 21 June 201110.
- Page 160 and 161: FM2 - Cross Section 21 July 201143.
- Page 162 and 163: HYDROGRAPHIC STATIONFM9 - SOUTH WAM
- Page 164 and 165: HYDROGRAPHIC STATIONFM7 - Stony Cre
- Page 166 and 167: HYDROGRAPHIC STATIONFM5 - South Wam
- Page 168 and 169: HYDROGRAPHIC STATIONFM3 - Lower Wam
- Page 170 and 171: HYDROGRAPHIC STATIONFM1 - Upper Wam
- Page 172 and 173: Annual Environmental Management Rep
- Page 174 and 175: Annual Environmental Management Rep
- Page 176 and 177: Annual Environmental Management Rep
- Page 178 and 179: Annual Environmental Management Rep
- Page 180 and 181: Annual Environmental Management Rep
- Page 182 and 183: Annual Environmental Management Rep
- Page 184 and 185: Annual Environmental Management Rep
- Page 186 and 187: 10.09.08.07.06.05.0Annual Environme
- Page 188 and 189:
Annual Environmental Management Rep
- Page 190 and 191:
Wambo Coal MineAnnual Report_______
- Page 192 and 193:
EXECUTIVE SUMMARYGlobal Acoustics w
- Page 194 and 195:
Table of Contents1 INTRODUCTION....
- Page 196 and 197:
The survey purpose is to quantify a
- Page 198 and 199:
1.3 TerminologySome definitions of
- Page 200 and 201:
1.5 Wambo Coal Rail Spur Developmen
- Page 202 and 203:
2 METHODOLOGY2.1 Assessment Method2
- Page 204 and 205:
Table 3.2 L A1(1 minute) dB GENERAT
- Page 206 and 207:
Table 3.4 L A1(1 minute) dB GENERAT
- Page 208 and 209:
Table 3.6 L A1(1 minute) dB GENERAT
- Page 210 and 211:
Table 3.8 L A1(1 minute) dB GENERAT
- Page 212 and 213:
Table 3.10L A1(1 minute) dB GENERAT
- Page 214 and 215:
Table 3.12 L A1(1 minute) dB GENERA
- Page 216 and 217:
Table 3.14 L A1(1 minute) dB GENERA
- Page 218 and 219:
Table 3.16 L A1(1 minute) dB GENERA
- Page 220 and 221:
4 SUMMARY OF COMPLIANCE4.1 SummaryN
- Page 222 and 223:
DayEvening/NightNightLand NumberL A
- Page 224 and 225:
A.2 Wambo Rail Spur Development Con
- Page 226 and 227:
compliance with the LAeq(15 minute)
- Page 228 and 229:
2010 Annual EcologicalMonitoring Re
- Page 230 and 231:
Executive SummaryRPS Australia East
- Page 232 and 233:
ContentsEXECUTIVE SUMMARYI1 INTRODU
- Page 234 and 235:
1 IntroductionRPS Australia East (R
- Page 236 and 237:
1.2 Qualifications and Licensing1.2
- Page 238 and 239:
Figure 2-1: Locations of Flora Moni
- Page 240 and 241:
• In 2007 all quadrats recorded i
- Page 242 and 243:
2.3 Discussion2.3.1 Species Diversi
- Page 244 and 245:
species specific herbicide), no con
- Page 246 and 247:
3 FaunaFive types of targeted surve
- Page 248 and 249:
Bird survey locations are not marke
- Page 250 and 251:
Figure 3-2: Threatened Species Loca
- Page 252 and 253:
Species Abundance in 2010The number
- Page 254 and 255:
• Observer bias. Likely variation
- Page 256 and 257:
Common Brushtail Possum was identif
- Page 258 and 259:
• Understorey characteristics;•
- Page 260 and 261:
Figure 4-2: Riparian Section Condit
- Page 262 and 263:
Sections• A relatively high numbe
- Page 264 and 265:
4.4 RecommendationsImplementation o
- Page 266 and 267:
Appendix 3Summary ofEnvironmental I
- Page 268 and 269:
Wambo Coal Pty Limited2010-2011 AEM
- Page 270 and 271:
Wambo Coal Pty Limited2010-2011 AEM
- Page 272 and 273:
Appendix 4Register of CommunityComp
- Page 274 and 275:
Wambo Coal Pty Limited2010-2011 AEM
- Page 276 and 277:
NoDate & TimeReceivedNature of Comp
- Page 278 and 279:
Appendix 5Rehabilitation Plan
- Page 280 and 281:
aemcWambo Coal Mine, Rail Loop and
- Page 282 and 283:
aemcWambo Coal Mine, Rail Loop and
- Page 284 and 285:
aemcWambo Coal Mine, Rail Loop and
- Page 286 and 287:
aemcWambo Coal Mine, Rail Loop and
- Page 288 and 289:
aemcWambo Coal Mine, Rail Loop and
- Page 290 and 291:
aemcWambo Coal Mine, Rail Loop and
- Page 292 and 293:
aemcWambo Coal Mine, Rail Loop and
- Page 294 and 295:
aemcWambo Coal Mine, Rail Loop and
- Page 296 and 297:
aemcWambo Coal Mine, Rail Loop and
- Page 298 and 299:
aemcWambo Coal Mine, Rail Loop and
- Page 300 and 301:
aemcWambo Coal Mine, Rail Loop and
- Page 302 and 303:
aemcWambo Coal Mine, Rail Loop and
- Page 304 and 305:
aemcWambo Coal Mine, Rail Loop and
- Page 306 and 307:
aemcWambo Coal Mine, Rail Loop and
- Page 308 and 309:
aemcWambo Coal Mine, Rail Loop and
- Page 310 and 311:
aemcWambo Coal Mine, Rail Loop and
- Page 312 and 313:
aemcWambo Coal Mine, Rail Loop and
- Page 314 and 315:
aemcWambo Coal Mine, Rail Loop and
- Page 316 and 317:
aemcWambo Coal Mine, Rail Loop and
- Page 318 and 319:
aemcWambo Coal Mine, Rail Loop and
- Page 320 and 321:
aemcWambo Coal Mine, Rail Loop and
- Page 322 and 323:
aemcWambo Coal Mine, Rail Loop and
- Page 324 and 325:
aemcWambo Coal Mine, Rail Loop and
- Page 326 and 327:
aemcWambo Coal Mine, Rail Loop and
- Page 328 and 329:
aemcWambo Coal Mine, Rail Loop and
- Page 330 and 331:
aemcWambo Coal Mine, Rail Loop and
- Page 332 and 333:
aemcWambo Coal Mine, Rail Loop and
- Page 334 and 335:
aemcWambo Coal Mine, Rail Loop and
- Page 336 and 337:
aemcWambo Coal Mine, Rail Loop and
- Page 338 and 339:
aemcWambo Coal Mine, Rail Loop and
- Page 340 and 341:
aemcWambo Coal Mine, Rail Loop and
- Page 342 and 343:
aemcWambo Coal Mine, Rail Loop and
- Page 344 and 345:
aemcWambo Coal Mine, Rail Loop and
- Page 346 and 347:
aemcWambo Coal Mine, Rail Loop and
- Page 348 and 349:
aemcWambo Coal Mine, Rail Loop and
- Page 350 and 351:
aemcWambo Coal Mine, Rail Loop and
- Page 352 and 353:
aemcWambo Coal Mine, Rail Loop and
- Page 354 and 355:
aemcWambo Coal Mine, Rail Loop and
- Page 356 and 357:
aemcWambo Coal Mine, Rail Loop and
- Page 358 and 359:
aemcWambo Coal Mine, Rail Loop and
- Page 360 and 361:
aemcWambo Coal Mine, Rail Loop and
- Page 362 and 363:
aemcWambo Coal Mine, Rail Loop and
- Page 364 and 365:
aemcWambo Coal Mine, Rail Loop and
- Page 366 and 367:
aemcWambo Coal Mine, Rail Loop and
- Page 368 and 369:
aemcWambo Coal Mine, Rail Loop and
- Page 370 and 371:
aemcWambo Coal Mine, Rail Loop and
- Page 372 and 373:
aemcWambo Coal Mine, Rail Loop and
- Page 374 and 375:
aemcWambo Coal Mine, Rail Loop and
- Page 376:
aemcWambo Coal Mine, Rail Loop and


