- Page 1 and 2:
INTSIKA YETHU LOCALMUNICIPALITYINTE
- Page 3 and 4:
Table of ContentsExecutive Summary
- Page 5 and 6:
6.4.4 Job creation, enterprise form
- Page 7 and 8:
Acronym ListABETAIDSASGISABOPCBPCDW
- Page 9 and 10:
List of TablesTable 1: Distribution
- Page 11 and 12:
Executive SummaryIntsika Yethu Loca
- Page 13 and 14:
Development strategies, projects an
- Page 15 and 16:
Chapter 1: Introduction and Plannin
- Page 17 and 18:
ActorsRole and Responsibilitiestask
- Page 19 and 20:
Item Activities Deliverables Respon
- Page 21 and 22:
Item Activities Deliverables Respon
- Page 23 and 24:
Planning PhaseMonitoring of impleme
- Page 25 and 26:
Chart 2: Ward issues identified wit
- Page 27 and 28:
The constitutional allocation of
- Page 29 and 30:
ServicesMunicipal parks &recreation
- Page 31 and 32:
some of the Section 79 Committees w
- Page 33 and 34:
As the municipality forges onwards
- Page 35 and 36:
Figure 1: Municipal Manager’s Off
- Page 37 and 38:
Figure 3: Finances organisational s
- Page 39 and 40:
The Director of Local Economic Deve
- Page 41 and 42:
compilation of the IDP, the Directo
- Page 43 and 44:
Table 12: Existing Institutional Po
- Page 45 and 46:
(Part B) The Development Context an
- Page 47 and 48:
Table 15: Poverty rates from 1995-2
- Page 49 and 50:
Table 16: Social Grants recipients
- Page 51 and 52:
3.4 Human Development IndexThe leve
- Page 53 and 54:
3.6 Economic DataChart 8: Gross Val
- Page 55 and 56:
Community;Social and personal servi
- Page 57 and 58:
Map 1: Spatial PrioritiesSource: IY
- Page 59 and 60:
Table 18: Prioritised Secondary Nod
- Page 61 and 62:
Map 3: Special Development AreasSou
- Page 63 and 64:
Settlement ZoneTypeLocality anddesc
- Page 65 and 66:
Map 5: Land Reform ZoneSource: IYLM
- Page 67 and 68:
TechnicalService ClusterSocial Need
- Page 69 and 70:
The above table indicates the exist
- Page 71 and 72:
Map 6: Water ResourcesSource: IYLM
- Page 73 and 74:
used form of energy in IYLM with an
- Page 75 and 76:
municipality maintains a formal hou
- Page 77 and 78:
Increase graduate output in areas o
- Page 79 and 80:
and function of Municipal Health Se
- Page 81 and 82:
Table 28: IYLM Waste Generation Rat
- Page 83 and 84:
IYLM is not immune to emergencies a
- Page 85 and 86:
IYLM and all its stakeholders and c
- Page 87 and 88:
Table 29: Tourism Facilities in IYL
- Page 89 and 90:
Figure 8: Availability of activitie
- Page 91 and 92:
Map 8: TourismSource: IYLM Spatial
- Page 93 and 94:
Map 9: Proposals Local Economic Dev
- Page 95 and 96:
5.4.6 ForestryForestry is the secon
- Page 97 and 98:
5.4.7 Environment ManagementIt is e
- Page 99 and 100:
municipality, and specifically the
- Page 101 and 102:
In terms of alignment and addressin
- Page 103 and 104:
6.4.4 Job creation, enterprise form
- Page 105 and 106:
IMPROVE SERVICE DELIVERYSOCIO-ECONO
- Page 107 and 108:
6.5.1 KPA 1: Municipal Transformati
- Page 109 and 110:
Strategic Objective: To enhance gov
- Page 111 and 112:
6.5.2 KPA 2: Basic Services and Inf
- Page 113 and 114:
Strategic Objective: To improve acc
- Page 115 and 116:
Strategic Objective: To improve the
- Page 117 and 118:
Strategic Objective: To improve the
- Page 119 and 120:
6.5.3 KPA 3: Local Economic Develop
- Page 121 and 122:
Strategic Objective: To contribute
- Page 123 and 124:
Training of allsuppliersNumber of l
- Page 125 and 126:
Strategic Objective: To increase re
- Page 127 and 128:
(MPAC)117
- Page 129 and 130:
6.6 Projects and ProgrammesThe proj
- Page 131 and 132:
Dept.KPA: Basic Services and Infras
- Page 133 and 134:
Dept.KPA: Basic Services and Infras
- Page 135 and 136:
KPA: Basic Services and Infrastruct
- Page 137 and 138:
KPA: Basic Services and Infrastruct
- Page 139 and 140:
KPA: Basic Services and Infrastruct
- Page 141 and 142:
KPA: Local Economic DevelopmentFina
- Page 143:
KPA: Local Economic DevelopmentFina
- Page 146 and 147:
136
- Page 148 and 149:
IYLM Municipal Manager's OfficeCust
- Page 150 and 151: KPA: Basic Services and Infrastruct
- Page 152 and 153: KPA: Basic Services and Infrastruct
- Page 154 and 155: KPA: Local Economic DevelopmentDept
- Page 156 and 157: 6.7.4 KPA 4: Financial Management a
- Page 158 and 159: Chapter 4: Performance Management S
- Page 160 and 161: c) Clarifies the roles and responsi
- Page 162 and 163: f) The percentage of a municipality
- Page 164 and 165: 7.2.6 The PMS in relation to the ID
- Page 166 and 167: Personal Development plan: these ar
- Page 168 and 169: 158
- Page 170 and 171: Table 40: Monthly revenue projectio
- Page 172 and 173: Table 42: Monthly expenditure proje
- Page 174 and 175: 7.6.1 Quarterly service delivery ta
- Page 176 and 177: Strategic Objective: To enhance gov
- Page 178 and 179: 7.6.1.2 KPA 2: Basic Services and I
- Page 180 and 181: Cluster: Social Needs Cluster (with
- Page 182 and 183: Traffic SafetyEducation &awarenesst
- Page 184 and 185: Strategic Objective: To improve the
- Page 186 and 187: 7.6.1.3 KPA 3: Local Economic Devel
- Page 188 and 189: Strategic Objective: To contribute
- Page 190 and 191: Training of allsuppliersNumber of l
- Page 192 and 193: Strategic Objective: To increase re
- Page 194 and 195: Strategic Objective: To ensure codi
- Page 196 and 197: Chapter 5: Financial Plan and Budge
- Page 198 and 199: donations and subsidies are investi
- Page 202 and 203: The three year financial plan inclu
- Page 204 and 205: PERSONNEL/PROJECT/PROGRAMMEBUDGET 2
- Page 206 and 207: PERSONNEL/PROJECT/PROGRAMMEBUDGET 2
- Page 208 and 209: 8.10 Financial Policies8.10.1 Amend
- Page 210 and 211: Chapter 6: ApprovalThe Draft IDP 20
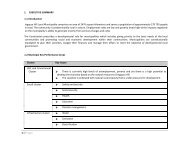
- Page 212 and 213: Table 2: Current Plans with CHDM or