Annual Report and Accounts 2012/13 - Royal Bournemouth Hospital
Annual Report and Accounts 2012/13 - Royal Bournemouth Hospital
Annual Report and Accounts 2012/13 - Royal Bournemouth Hospital
- No tags were found...
Create successful ePaper yourself
Turn your PDF publications into a flip-book with our unique Google optimized e-Paper software.
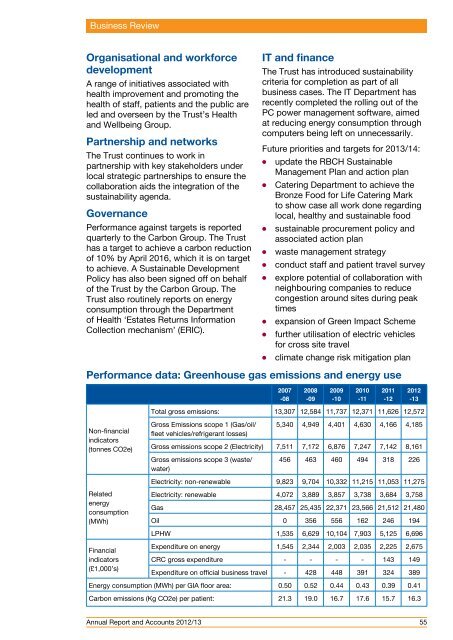
Business ReviewOrganisational <strong>and</strong> workforcedevelopmentA range of initiatives associated withhealth improvement <strong>and</strong> promoting thehealth of staff, patients <strong>and</strong> the public areled <strong>and</strong> overseen by the Trust’s Health<strong>and</strong> Wellbeing Group.Partnership <strong>and</strong> networksThe Trust continues to work inpartnership with key stakeholders underlocal strategic partnerships to ensure thecollaboration aids the integration of thesustainability agenda.GovernancePerformance against targets is reportedquarterly to the Carbon Group. The Trusthas a target to achieve a carbon reductionof 10% by April 2016, which it is on targetto achieve. A Sustainable DevelopmentPolicy has also been signed off on behalfof the Trust by the Carbon Group. TheTrust also routinely reports on energyconsumption through the Departmentof Health ‘Estates Returns InformationCollection mechanism’ (ERIC).IT <strong>and</strong> financeThe Trust has introduced sustainabilitycriteria for completion as part of allbusiness cases. The IT Department hasrecently completed the rolling out of thePC power management software, aimedat reducing energy consumption throughcomputers being left on unnecessarily.Future priorities <strong>and</strong> targets for 20<strong>13</strong>/14:l update the RBCH SustainableManagement Plan <strong>and</strong> action planl Catering Department to achieve theBronze Food for Life Catering Markto show case all work done regardinglocal, healthy <strong>and</strong> sustainable foodl sustainable procurement policy <strong>and</strong>associated action planl waste management strategyl conduct staff <strong>and</strong> patient travel surveyl explore potential of collaboration withneighbouring companies to reducecongestion around sites during peaktimesl expansion of Green Impact Schemel further utilisation of electric vehiclesfor cross site travell climate change risk mitigation planPerformance data: Greenhouse gas emissions <strong>and</strong> energy use2007-082008-092009-102010-112011-12<strong>2012</strong>-<strong>13</strong>Total gross emissions: <strong>13</strong>,307 12,584 11,737 12,371 11,626 12,572Non-financialindicators(tonnes CO2e)Gross Emissions scope 1 (Gas/oil/fleet vehicles/refrigerant losses)5,340 4,949 4,401 4,630 4,166 4,185Gross emissions scope 2 (Electricity) 7,511 7,172 6,876 7,247 7,142 8,161Gross emissions scope 3 (waste/water)456 463 460 494 318 226Electricity: non-renewable 9,823 9,704 10,332 11,215 11,053 11,275Relatedenergyconsumption(MWh)Electricity: renewable 4,072 3,889 3,857 3,738 3,684 3,758Gas 28,457 25,435 22,371 23,566 21,512 21,480Oil 0 356 556 162 246 194LPHW 1,535 6,629 10,104 7,903 5,125 6,696Financialindicators(£1,000’s)Expenditure on energy 1,545 2,344 2,003 2,035 2,225 2,675CRC gross expenditure - - - - 143 149Expenditure on official business travel - 428 448 391 324 389Energy consumption (MWh) per GIA floor area: 0.50 0.52 0.44 0.43 0.39 0.41Carbon emissions (Kg CO2e) per patient: 21.3 19.0 16.7 17.6 15.7 16.3<strong>Annual</strong> <strong>Report</strong> <strong>and</strong> <strong>Accounts</strong> <strong>2012</strong>/<strong>13</strong> 55


