- Page 3:
The Royal Bournemouth and Christchu
- Page 8 and 9:
Foreword from the Chief Executive2.
- Page 11 and 12:
Directors’ Reportl to work with p
- Page 13 and 14:
Directors’ ReportKaren Allman, Di
- Page 15 and 16:
Directors’ ReportParamedics now t
- Page 17 and 18:
Directors’ ReportNurses shortlist
- Page 19 and 20:
Directors’ ReportAnother ‘gold
- Page 21 and 22:
Directors’ ReportGenerous donatio
- Page 23 and 24:
Directors’ Reportl surveying pati
- Page 25 and 26:
Business ReviewSafetyThe Trust achi
- Page 27 and 28:
Business ReviewPatients received ti
- Page 29 and 30:
Business ReviewBringing together th
- Page 31 and 32:
Business Reviewto ensure patient ca
- Page 33 and 34:
Business Review4.5 Trends and facto
- Page 35 and 36:
Business Reviewl Healthcare Assuran
- Page 37 and 38:
Business Reviewpatients and are tra
- Page 39 and 40:
Business ReviewResearch activityThi
- Page 41 and 42: Business Reviewl molecular patholog
- Page 43 and 44: Business ReviewNew film supports st
- Page 45 and 46: Business ReviewSignificantly worsen
- Page 47 and 48: Business ReviewChange since 2011sur
- Page 49 and 50: Business ReviewQuestion 2012 Averag
- Page 51 and 52: Business ReviewTeam of the Year Awa
- Page 53 and 54: Business ReviewSustainableManagemen
- Page 55 and 56: Business ReviewOrganisational and w
- Page 57 and 58: Business ReviewPerformance data: Wa
- Page 59 and 60: Quality Report5. Quality Report 201
- Page 61 and 62: Quality ReportThe data is recorded
- Page 63 and 64: Quality Reportl Provide ward scorec
- Page 65 and 66: Quality ReportStatements of Assuran
- Page 67 and 68: Quality ReportHead and Neck Oncolog
- Page 69 and 70: Quality ReportNational Confidential
- Page 71 and 72: Quality ReportStatement Four:Use of
- Page 73 and 74: Quality Reportthree serious inciden
- Page 75 and 76: Quality ReportPatient safety and qu
- Page 77 and 78: Quality ReportClean environmentAs p
- Page 79 and 80: Quality ReportThe Department of Hea
- Page 81 and 82: Quality ReportIn May 2013, the Trus
- Page 83 and 84: Quality ReportThe Trust’s overall
- Page 85 and 86: Quality ReportCancer patient experi
- Page 87 and 88: Quality ReportReal time patient fee
- Page 89 and 90: Quality ReportChanges resulting fro
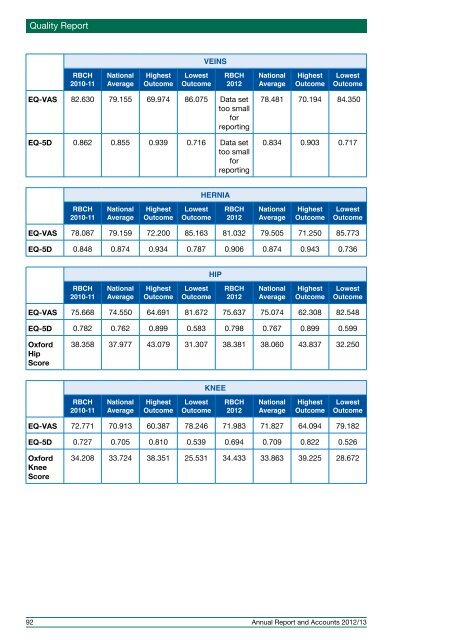
- Page 91: Quality ReportCompliance against ne
- Page 95 and 96: Quality ReportThe Trust has a simil
- Page 97 and 98: Quality Reportpriorities for the ye
- Page 99 and 100: Quality Reportimportance of gaining
- Page 101 and 102: Quality ReportAnnex B - Statement o
- Page 103 and 104: Quality ReportAnnex C - Independent
- Page 105 and 106: Quality ReportLimitationsNon-financ
- Page 107 and 108: Governance ReportNon-ExecutiveDirec
- Page 109 and 110: Governance Reportl reviews the inte
- Page 111 and 112: Governance ReportMeetings of the No
- Page 113 and 114: Governance ReportMedian Total Remun
- Page 115 and 116: Governance ReportPublic governors -
- Page 117 and 118: Governance ReportName Title Constit
- Page 119 and 120: Governance ReportAs at 31 March 201
- Page 121 and 122: Financial AccountsFinancial Stateme
- Page 123 and 124: Financial AccountsThe Foundation Tr
- Page 125 and 126: Financial AccountsAccounting Office
- Page 127 and 128: Financial AccountsThe risk and cont
- Page 129 and 130: Financial AccountsThere has been an
- Page 131 and 132: Financial Accountsmonitoring meetin
- Page 133 and 134: Financial AccountsAnnual Quality Re
- Page 135 and 136: Financial AccountsAuditors’ Repor
- Page 137 and 138: Financial AccountsStatement of Comp
- Page 139 and 140: Financial AccountsStatement of Chan
- Page 141 and 142: Financial AccountsNotes to the acco
- Page 143 and 144:
Financial Accounts1.3 Expenditure o
- Page 145 and 146:
Financial Accountsanticipated to ha
- Page 147 and 148:
Financial Accountsl the sale must b
- Page 149 and 150:
Financial AccountsLoans and receiva
- Page 151 and 152:
Financial Accountsworking capital f
- Page 153 and 154:
Financial Accounts4.2 Other operati
- Page 155 and 156:
Financial Accounts8 Operating lease
- Page 157 and 158:
Financial Accounts10 Retirements du
- Page 159 and 160:
Financial Accounts15 Impairment of
- Page 161 and 162:
Financial Accounts18.3 Provision fo
- Page 163 and 164:
Financial Accounts23 Prudential bor
- Page 165 and 166:
Financial AccountsDuring the year t
- Page 167 and 168:
Financial Accounts28 Financial inst
- Page 169 and 170:
Financial Accounts30 Losses and spe
- Page 172:
The Royal Bournemouth and Christchu