Annual Report and Accounts 2012/13 - Royal Bournemouth Hospital
Annual Report and Accounts 2012/13 - Royal Bournemouth Hospital
Annual Report and Accounts 2012/13 - Royal Bournemouth Hospital
- No tags were found...

Create successful ePaper yourself
Turn your PDF publications into a flip-book with our unique Google optimized e-Paper software.
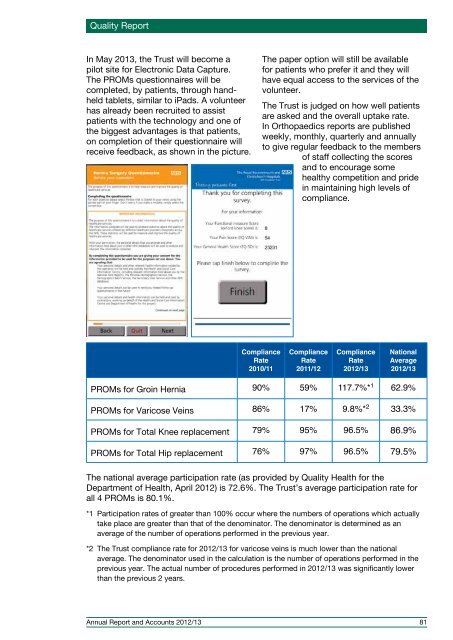
Quality <strong>Report</strong>In May 20<strong>13</strong>, the Trust will become apilot site for Electronic Data Capture.The PROMs questionnaires will becompleted, by patients, through h<strong>and</strong>heldtablets, similar to iPads. A volunteerhas already been recruited to assistpatients with the technology <strong>and</strong> one ofthe biggest advantages is that patients,on completion of their questionnaire willreceive feedback, as shown in the picture.The paper option will still be availablefor patients who prefer it <strong>and</strong> they willhave equal access to the services of thevolunteer.The Trust is judged on how well patientsare asked <strong>and</strong> the overall uptake rate.In Orthopaedics reports are publishedweekly, monthly, quarterly <strong>and</strong> annuallyto give regular feedback to the membersof staff collecting the scores<strong>and</strong> to encourage somehealthy competition <strong>and</strong> pridein maintaining high levels ofcompliance.ComplianceRate2010/11ComplianceRate2011/12ComplianceRate<strong>2012</strong>/<strong>13</strong>NationalAverage<strong>2012</strong>/<strong>13</strong>PROMs for Groin Hernia 90% 59% 117.7%* 1 62.9%PROMs for Varicose Veins 86% 17% 9.8%* 2 33.3%PROMs for Total Knee replacement 79% 95% 96.5% 86.9%PROMs for Total Hip replacement 76% 97% 96.5% 79.5%The national average participation rate (as provided by Quality Health for theDepartment of Health, April <strong>2012</strong>) is 72.6%. The Trust’s average participation rate forall 4 PROMs is 80.1%.*1 Participation rates of greater than 100% occur where the numbers of operations which actuallytake place are greater than that of the denominator. The denominator is determined as anaverage of the number of operations performed in the previous year.*2 The Trust compliance rate for <strong>2012</strong>/<strong>13</strong> for varicose veins is much lower than the nationalaverage. The denominator used in the calculation is the number of operations performed in theprevious year. The actual number of procedures performed in <strong>2012</strong>/<strong>13</strong> was significantly lowerthan the previous 2 years.<strong>Annual</strong> <strong>Report</strong> <strong>and</strong> <strong>Accounts</strong> <strong>2012</strong>/<strong>13</strong> 81