Annual Report and Accounts 2012/13 - Royal Bournemouth Hospital
Annual Report and Accounts 2012/13 - Royal Bournemouth Hospital
Annual Report and Accounts 2012/13 - Royal Bournemouth Hospital
- No tags were found...

Create successful ePaper yourself
Turn your PDF publications into a flip-book with our unique Google optimized e-Paper software.
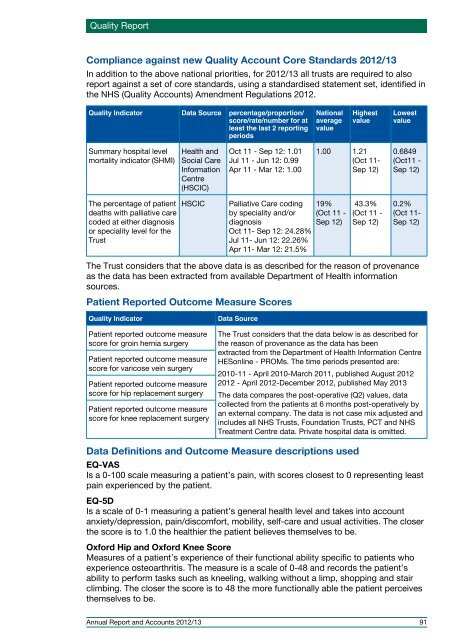
Quality <strong>Report</strong>Compliance against new Quality Account Core St<strong>and</strong>ards <strong>2012</strong>/<strong>13</strong>In addition to the above national priorities, for <strong>2012</strong>/<strong>13</strong> all trusts are required to alsoreport against a set of core st<strong>and</strong>ards, using a st<strong>and</strong>ardised statement set, identified inthe NHS (Quality <strong>Accounts</strong>) Amendment Regulations <strong>2012</strong>.Quality Indicator Data Source percentage/proportion/score/rate/number for atleast the last 2 reportingperiodsNationalaveragevalueHighestvalueLowestvalueSummary hospital levelmortality indicator (SHMI)Health <strong>and</strong>Social CareInformationCentre(HSCIC)Oct 11 - Sep 12: 1.01Jul 11 - Jun 12: 0.99Apr 11 - Mar 12: 1.001.00 1.21(Oct 11-Sep 12)0.6849(Oct11 -Sep 12)The percentage of patientdeaths with palliative carecoded at either diagnosisor speciality level for theTrustHSCICPalliative Care codingby speciality <strong>and</strong>/ordiagnosisOct 11- Sep 12: 24.28%Jul 11- Jun 12: 22.26%Apr 11- Mar 12: 21.5%19%(Oct 11 -Sep 12)43.3%(Oct 11 -Sep 12)0.2%(Oct 11-Sep 12)The Trust considers that the above data is as described for the reason of provenanceas the data has been extracted from available Department of Health informationsources.Patient <strong>Report</strong>ed Outcome Measure ScoresQuality IndicatorPatient reported outcome measurescore for groin hernia surgeryPatient reported outcome measurescore for varicose vein surgeryPatient reported outcome measurescore for hip replacement surgeryPatient reported outcome measurescore for knee replacement surgeryData SourceThe Trust considers that the data below is as described forthe reason of provenance as the data has beenextracted from the Department of Health Information CentreHESonline - PROMs. The time periods presented are:2010-11 - April 2010-March 2011, published August <strong>2012</strong><strong>2012</strong> - April <strong>2012</strong>-December <strong>2012</strong>, published May 20<strong>13</strong>The data compares the post-operative (Q2) values, datacollected from the patients at 6 months post-operatively byan external company. The data is not case mix adjusted <strong>and</strong>includes all NHS Trusts, Foundation Trusts, PCT <strong>and</strong> NHSTreatment Centre data. Private hospital data is omitted.Data Definitions <strong>and</strong> Outcome Measure descriptions usedEQ-VASIs a 0-100 scale measuring a patient’s pain, with scores closest to 0 representing leastpain experienced by the patient.EQ-5DIs a scale of 0-1 measuring a patient’s general health level <strong>and</strong> takes into accountanxiety/depression, pain/discomfort, mobility, self-care <strong>and</strong> usual activities. The closerthe score is to 1.0 the healthier the patient believes themselves to be.Oxford Hip <strong>and</strong> Oxford Knee ScoreMeasures of a patient’s experience of their functional ability specific to patients whoexperience osteoarthritis. The measure is a scale of 0-48 <strong>and</strong> records the patient’sability to perform tasks such as kneeling, walking without a limp, shopping <strong>and</strong> stairclimbing. The closer the score is to 48 the more functionally able the patient perceivesthemselves to be.<strong>Annual</strong> <strong>Report</strong> <strong>and</strong> <strong>Accounts</strong> <strong>2012</strong>/<strong>13</strong> 91