Technical Report No. 8 PORT AND SHIPPING
Technical Report No. 8 PORT AND SHIPPING
Technical Report No. 8 PORT AND SHIPPING

Create successful ePaper yourself
Turn your PDF publications into a flip-book with our unique Google optimized e-Paper software.
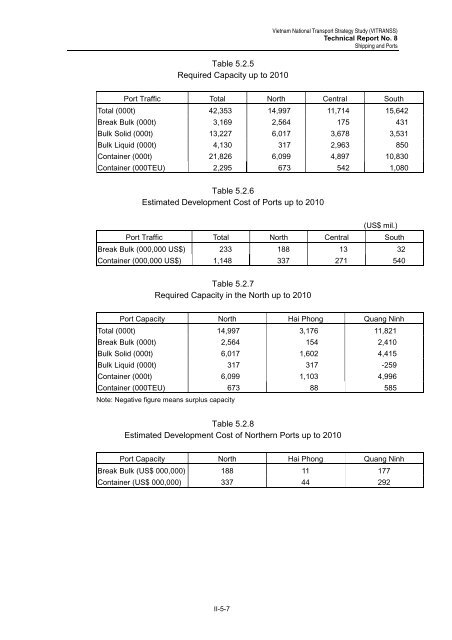
Table 5.2.5<br />
Required Capacity up to 2010<br />
II-5-7<br />
Vietnam National Transport Strategy Study (VITRANSS)<br />
<strong>Technical</strong> <strong>Report</strong> <strong>No</strong>. 8<br />
Shipping and Ports<br />
Port Traffic Total <strong>No</strong>rth Central South<br />
Total (000t) 42,353 14,997 11,714 15,642<br />
Break Bulk (000t) 3,169 2,564 175 431<br />
Bulk Solid (000t) 13,227 6,017 3,678 3,531<br />
Bulk Liquid (000t) 4,130 317 2,963 850<br />
Container (000t) 21,826 6,099 4,897 10,830<br />
Container (000TEU) 2,295 673 542 1,080<br />
Table 5.2.6<br />
Estimated Development Cost of Ports up to 2010<br />
Port Traffic Total <strong>No</strong>rth Central<br />
(US$ mil.)<br />
South<br />
Break Bulk (000,000 US$) 233 188 13 32<br />
Container (000,000 US$) 1,148 337 271 540<br />
Table 5.2.7<br />
Required Capacity in the <strong>No</strong>rth up to 2010<br />
Port Capacity <strong>No</strong>rth Hai Phong Quang Ninh<br />
Total (000t) 14,997 3,176 11,821<br />
Break Bulk (000t) 2,564 154 2,410<br />
Bulk Solid (000t) 6,017 1,602 4,415<br />
Bulk Liquid (000t) 317 317 -259<br />
Container (000t) 6,099 1,103 4,996<br />
Container (000TEU) 673 88 585<br />
<strong>No</strong>te: Negative figure means surplus capacity<br />
Table 5.2.8<br />
Estimated Development Cost of <strong>No</strong>rthern Ports up to 2010<br />
Port Capacity <strong>No</strong>rth Hai Phong Quang Ninh<br />
Break Bulk (US$ 000,000) 188 11 177<br />
Container (US$ 000,000) 337 44 292