Technical Report No. 8 PORT AND SHIPPING
Technical Report No. 8 PORT AND SHIPPING
Technical Report No. 8 PORT AND SHIPPING

You also want an ePaper? Increase the reach of your titles
YUMPU automatically turns print PDFs into web optimized ePapers that Google loves.
3.4 Traffic Demand<br />
Port Traffic Volume and Characteristics<br />
II-3-8<br />
Vietnam National Transport Strategy Study (VITRANSS)<br />
<strong>Technical</strong> <strong>Report</strong> <strong>No</strong>. 8<br />
Shipping and Ports<br />
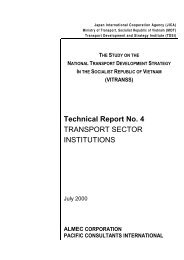
The “Statistical Yearbook, 1997” shows the port traffic volume since 1991. Before<br />
this year, it is believed that port traffic was greatly influenced by trade with<br />
communist countries. Therefore data after 1991 is reasonable for future<br />
estimation. Since 1991 the annual growth rate has exceeded 10% in five<br />
occasions while a minus growth was registered only once (1997). Overall,<br />
Vietnamese port traffic is demonstrating smooth growth (see Table 3.4.1 and<br />
Figure 3.4.1).<br />
Table 3.4.1<br />
Port Traffic in Major Ports<br />
Port 1991 1992 1993 1994 1995 1996 1997<br />
(tons)<br />
1998<br />
Hai Phong 2,433,400 2,378,200 2,706,300 3,249,000 4,515,000 4,809,000 4,600,000 5,442,000<br />
Saigon 4,159,600 5,004,000 5,508,600 6,438,600 7,212,000 7,340,000 6,821,000 7,700,000<br />
Quang Ninh 424,600 718,900 683,000 521,000 704,000 813,000 820,000 1,011,300<br />
Nghe An 126,200 132,900 182,200 305,500 310,000 462,000 480,000 473,600<br />
Danang 260,500 313,300 371,900 666,700 830,200 847,900 882,000 829,000<br />
Quy Nhon 300,400 335,000 411,800 403,000 447,000 554,700 838,000 953,900<br />
Nha Trang 148,000 154,500 181,000 214,000 343,400 426,000 424,000 485,000<br />
Can Tho n.a n.a n.a 65,800 125,900 183,200 202,000 332,300<br />
TOTAL 7,852,700 9,036,800 10,044,800 11,863,600 14,487,500 15,435,800 15,067,000 17,227,100<br />
Growth<br />
Rate (%/yr)<br />
15% 11% 18% 22% 7% -2% 14%<br />
Sources: Statistical Yearbook, 1997 and Annual <strong>Report</strong> by VINAMARINE, 1999<br />
Ton<br />
18,000.0<br />
16,000.0<br />
14,000.0<br />
12,000.0<br />
10,000.0<br />
8,000.0<br />
6,000.0<br />
4,000.0<br />
2,000.0<br />
0.0<br />
Figure 3.4.1<br />
Cargo Volume in Major Ports<br />
Year<br />
Total<br />
Foreign<br />
Export<br />
Import<br />
Domestic