Precipitation-Runoff and Streamflow-Routing Models for the ...
Precipitation-Runoff and Streamflow-Routing Models for the ...
Precipitation-Runoff and Streamflow-Routing Models for the ...
- No tags were found...

You also want an ePaper? Increase the reach of your titles
YUMPU automatically turns print PDFs into web optimized ePapers that Google loves.
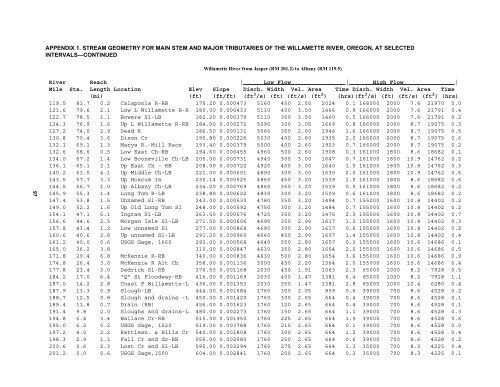
APPENDIX 1. STREAM GEOMETRY FOR MAIN STEM AND MAJOR TRIBUTARIES OF THE WILLAMETTE RIVER, OREGON, AT SELECTEDINTERVALS—CONTINUEDWillamette River from Jasper (RM 201.2) to Albany (RM 119.5)97River Reach | Low Flow | High Flow |Mile Sta. Length Location Elev Slope Disch. Width Vel. Area Time Disch. Width Vel. Area Time(mi) (ft) (ft/ft) (ft 3 /s) (ft) (ft/s) (ft 2 ) (hrs)(ft 3 /s) (ft) (ft/s) (ft 2 ) (hrs)119.5 81.7 0.2 Calapooia R-RB 175.20 0.000473 5160 450 2.55 2024 0.1 168000 2000 7.6 21970 0.0121.6 79.6 2.1 Low L Willamette R-R 180.00 0.000433 5130 400 3.50 1466 0.9 166000 2000 7.6 21791 0.4122.7 78.5 1.1 Bowers Sl-LB 182.20 0.000379 5110 350 3.50 1460 0.5 166000 2000 7.6 21791 0.2124.3 76.9 1.6 Up L Willamette R-RB 184.50 0.000272 5090 300 3.05 1669 0.8 166000 2000 8.7 19075 0.3127.2 74.0 2.9 Dead R 186.50 0.000131 5060 350 2.60 1946 1.6 166000 2000 8.7 19075 0.5130.8 70.4 3.6 Dixon Cr 190.80 0.000226 5030 400 2.60 1935 2.0 166000 2000 8.7 19075 0.6132.1 69.1 1.3 Marys R.-Mill Race 193.40 0.000379 5000 400 2.60 1923 0.7 166000 2000 8.7 19075 0.2132.6 68.6 0.5 Low East Ch-RB 194.60 0.000455 4960 500 2.60 1908 0.3 161000 1800 8.6 18682 0.1134.0 67.2 1.4 Low Booneville Ch-LB 200.00 0.000731 4940 300 3.00 1647 0.7 161000 1800 10.9 14762 0.2136.1 65.1 2.1 Up East Ch - RB 208.00 0.000722 4920 400 3.00 1640 1.0 161000 1800 10.9 14762 0.3140.2 61.0 4.1 Up Middle Ch-LB 221.00 0.000601 4890 300 3.00 1630 2.0 161000 1800 10.9 14762 0.6143.5 57.7 3.3 Up Hoacum Is 230.14 0.000525 4860 450 3.20 1519 1.5 161000 1800 8.6 18682 0.6144.5 56.7 1.0 Up Albany Ch-LB 234.20 0.000769 4860 350 3.20 1519 0.5 161000 1800 8.6 18682 0.2145.9 55.3 1.4 Long Tom R-LB 238.80 0.000622 4830 300 3.20 1509 0.6 161000 1800 8.6 18682 0.2147.4 53.8 1.5 Unnamed Sl-RB 243.00 0.000530 4780 350 3.20 1494 0.7 155000 1600 10.8 14402 0.2149.0 52.2 1.6 Up Old Long Tom Sl 248.00 0.000592 4750 300 3.20 1484 0.7 155000 1600 10.8 14402 0.2154.1 47.1 5.1 Ingram Sl-LB 263.50 0.000576 4720 350 3.20 1475 2.3 155000 1600 10.8 14402 0.7156.6 44.6 2.5 Morgan Isle Sl-LB 271.50 0.000606 4690 350 2.90 1617 1.3 155000 1600 10.8 14402 0.3157.8 43.4 1.2 Low unnamed Sl 277.00 0.000868 4690 300 2.90 1617 0.6 155000 1600 10.8 14402 0.2160.6 40.6 2.8 Up unnamed Sl-LB 291.20 0.000960 4660 450 2.90 1607 1.4 155000 1600 10.8 14402 0.4161.2 40.0 0.6 USGS Gage, 1660 293.00 0.000568 4640 350 2.80 1657 0.3 155000 1600 10.6 14686 0.1165.0 36.2 3.8 310.00 0.000847 4630 350 2.80 1654 2.0 155000 1600 10.6 14686 0.5171.8 29.4 6.8 McKenzie R-RB 340.00 0.000836 4630 500 2.80 1654 3.6 155000 1600 10.6 14686 0.9174.8 26.4 3.0 McKenzie R Alt Ch 358.00 0.001136 3000 450 2.20 1364 2.0 155000 1600 10.6 14686 0.4177.8 23.4 3.0 Dedrick Sl-RB 376.50 0.001168 2030 450 1.91 1063 2.3 65000 1000 8.2 7928 0.5184.2 17.0 6.4 “Q” St Floodway-RB 416.00 0.001169 2030 400 1.47 1381 6.4 65000 1000 8.2 7928 1.1187.0 14.2 2.8 Coast F Willamette-L 436.00 0.001353 2030 350 1.47 1381 2.8 65000 1000 10.4 6280 0.4187.9 13.3 0.9 Slough-LB 444.00 0.001684 1760 300 2.05 859 0.6 39000 700 8.6 4528 0.2188.7 12.5 0.8 Slough <strong>and</strong> drains -L 450.00 0.001420 1760 300 2.65 664 0.4 39000 700 8.6 4528 0.1189.4 11.8 0.7 Drain (RB) 456.00 0.001623 1760 120 2.65 664 0.4 39000 700 8.6 4528 0.1191.4 9.8 2.0 Sloughs <strong>and</strong> drains-L 480.00 0.002273 1760 150 2.65 664 1.1 39000 700 8.6 4528 0.3194.8 6.4 3.4 Wallace Cr-RB 515.00 0.001950 1760 225 2.65 664 1.9 39000 700 8.6 4528 0.6195.0 6.2 0.2 USGS Gage, 1520 519.00 0.003788 1760 215 2.65 664 0.1 39000 700 8.6 4528 0.0197.2 4.0 2.2 Rattlesn. & Hills Cr 540.00 0.001808 1760 300 2.65 664 1.2 39000 700 8.6 4528 0.4198.3 2.9 1.1 Fall Cr <strong>and</strong> dr-RB 555.00 0.002583 1760 250 2.65 664 0.6 39000 700 8.6 4528 0.2200.6 0.6 2.3 Lost Cr <strong>and</strong> Sl-LB 595.00 0.003294 1760 275 2.65 664 1.3 35000 700 8.3 4225 0.4201.2 0.0 0.6 USGS Gage,1500 604.00 0.002841 1760 200 2.65 664 0.3 35000 700 8.3 4225 0.1